# Technical Document Extraction: PSNR vs Training Steps
## Chart Overview
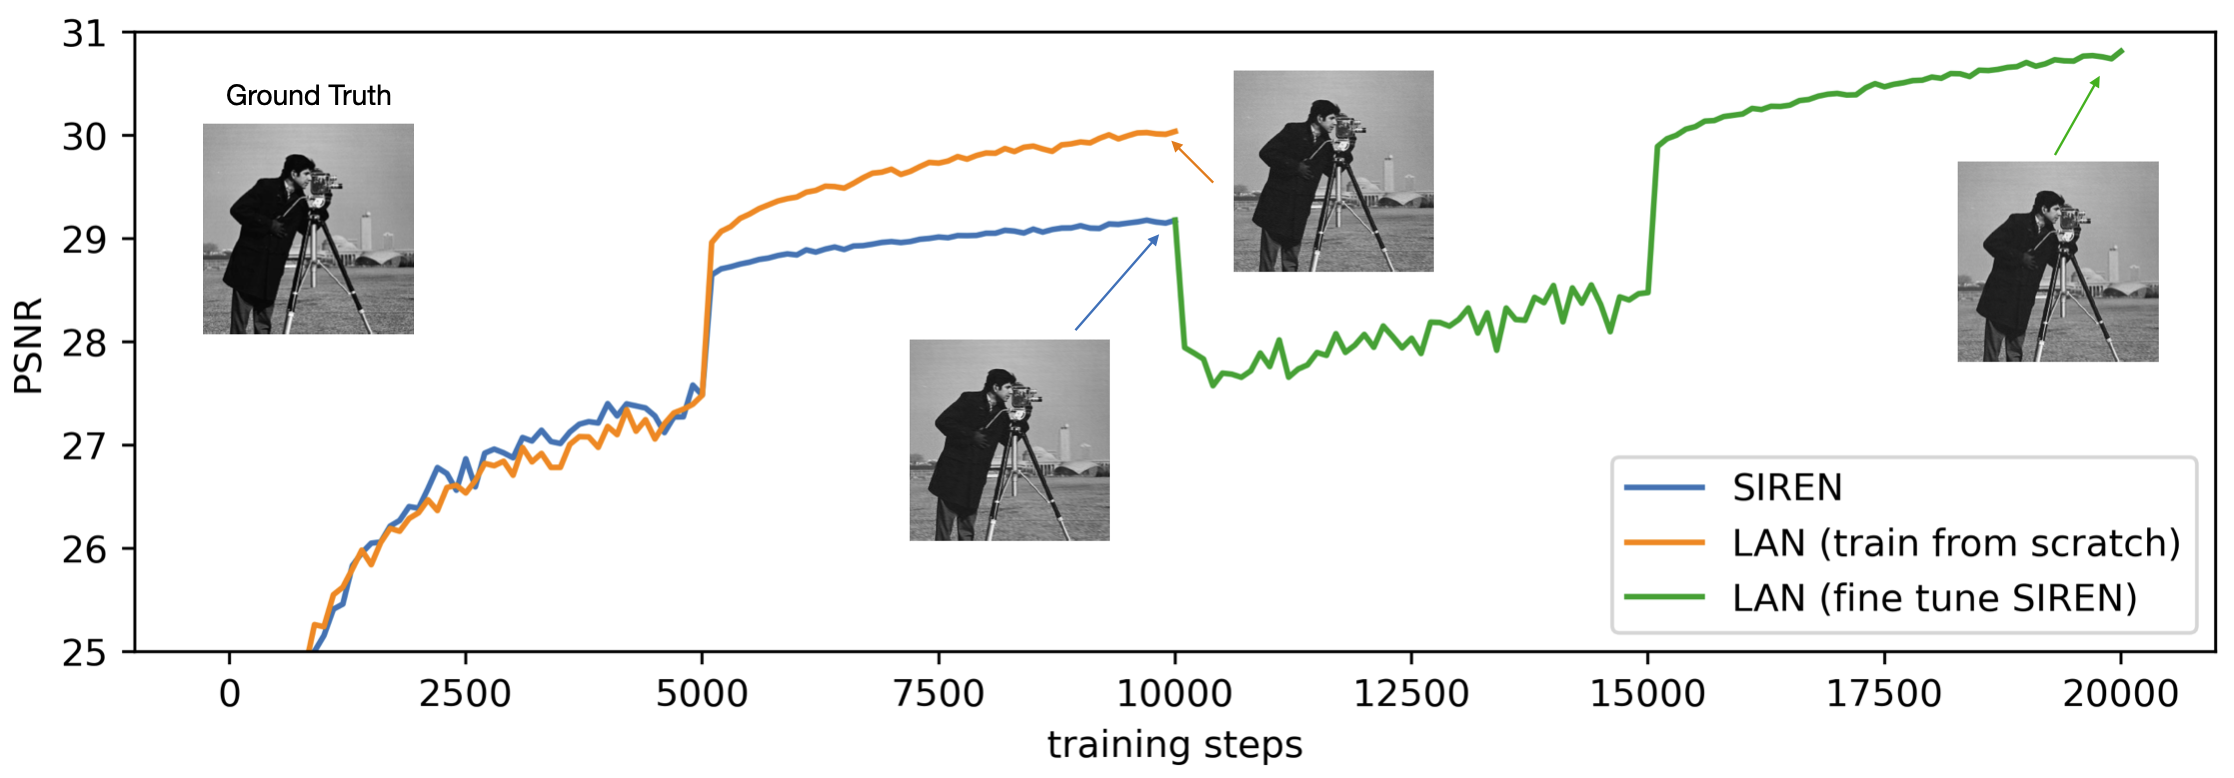
The image presents a line chart comparing the performance of three models (SIREN, LAN trained from scratch, LAN fine-tuned on SIREN) across training steps, measured by Peak Signal-to-Noise Ratio (PSNR). Three reference images labeled "Ground Truth" are spatially anchored to specific points on the chart.
---
### **Axis Labels & Scales**
- **X-axis**: `training steps` (0 to 20,000 in increments of 2,500)
- **Y-axis**: `PSNR` (25 to 31 in increments of 1)
- **Legend**: Located in the bottom-right corner, with three entries:
- **Blue**: SIREN
- **Orange**: LAN (train from scratch)
- **Green**: LAN (fine tune SIREN)
---
### **Key Trends & Data Points**
1. **SIREN (Blue Line)**
- **Trend**: Gradual upward slope with minor fluctuations.
- **Key Points**:
- Starts at ~25.2 PSNR at 0 steps.
- Reaches ~29.0 PSNR by 10,000 steps.
- Plateaus near ~29.2 PSNR after 15,000 steps.
2. **LAN (Train from Scratch) (Orange Line)**
- **Trend**: Steeper initial ascent, surpassing SIREN around 5,000 steps, then plateaus.
- **Key Points**:
- Starts at ~25.2 PSNR at 0 steps.
- Peaks at ~29.8 PSNR at ~7,500 steps (marked by an arrow pointing to the orange line).
- Declines slightly to ~29.6 PSNR by 10,000 steps.
3. **LAN (Fine Tune SIREN) (Green Line)**
- **Trend**: Initial dip, followed by rapid improvement after 10,000 steps, surpassing all other lines.
- **Key Points**:
- Starts at ~25.2 PSNR at 0 steps.
- Dips to ~27.5 PSNR at ~10,000 steps.
- Rises sharply to ~30.8 PSNR by 17,500 steps (marked by an arrow pointing to the green line).
- Maintains ~30.8 PSNR through 20,000 steps.
---
### **Embedded Images & Spatial Grounding**
1. **Ground Truth Image**
- Placed at the origin (x=0, y=25.2).
- Depicts a person operating a theodolite in an open field.
2. **Image at ~7,500 Steps**
- Positioned at x=7,500, y=29.8 (orange line peak).
- Shows the same individual with a theodolite, emphasizing the model's performance at this training step.
3. **Image at ~17,500 Steps**
- Positioned at x=17,500, y=30.8 (green line peak).
- Repeats the theodolite operator, highlighting the fine-tuned model's superior performance.
---
### **Legend Cross-Reference**
- **Blue (SIREN)**: Matches the gradual blue line.
- **Orange (LAN Train)**: Matches the orange line peaking at 7,500 steps.
- **Green (LAN Fine-Tune)**: Matches the green line peaking at 17,500 steps.
---
### **Component Isolation**
1. **Header**: No explicit header text; title inferred from axis labels.
2. **Main Chart**: Dominates the image, with three lines and three embedded images.
3. **Footer**: Legend occupies the bottom-right corner.
---
### **Textual Content**
- **Legend Labels**:
- SIREN
- LAN (train from scratch)
- LAN (fine tune SIREN)
- **Axis Titles**:
- `training steps` (x-axis)
- `PSNR` (y-axis)
- **Embedded Image Labels**:
- "Ground Truth" (top-left image)
---
### **Conclusion**
The chart demonstrates that fine-tuning LAN on SIREN (green line) achieves the highest PSNR (~30.8) by 17,500 steps, outperforming both SIREN (~29.2) and LAN trained from scratch (~29.6). The "Ground Truth" images contextualize the models' performance at critical training milestones.