## Line Chart: Llama-3.2-1B and Llama-3.2-3B Performance Across Layers
### Overview
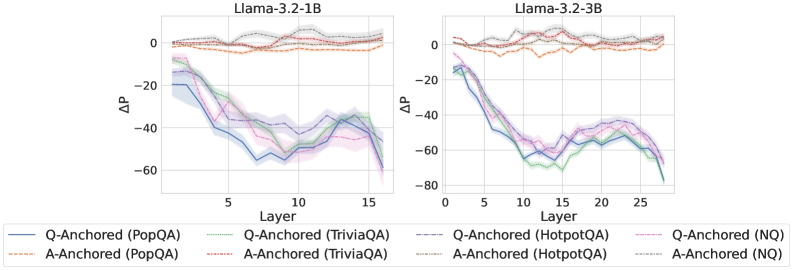
The image displays two line charts comparing the performance of different anchoring strategies (Q-Anchored vs. A-Anchored) across layers for two Llama-3.2 models (1B and 3B). The y-axis represents ΔP (change in performance), and the x-axis represents the layer number. Each line corresponds to a specific anchoring strategy and dataset (e.g., PopQA, TriviaQA, HotpotQA, NQ).
---
### Components/Axes
- **Panels**:
- **Left Panel**: Llama-3.2-1B (1 billion parameters).
- **Right Panel**: Llama-3.2-3B (3 billion parameters).
- **Axes**:
- **Y-axis (ΔP)**: Ranges from -80 to 0, labeled "ΔP".
- **X-axis (Layer)**: Ranges from 0 to 15 (left panel) and 0 to 25 (right panel), labeled "Layer".
- **Legend**: Located at the bottom, with seven entries:
1. **Q-Anchored (PopQA)**: Blue solid line.
2. **A-Anchored (PopQA)**: Orange dashed line.
3. **Q-Anchored (TriviaQA)**: Green dotted line.
4. **A-Anchored (TriviaQA)**: Red dotted line.
5. **Q-Anchored (HotpotQA)**: Purple dash-dot line.
6. **A-Anchored (HotpotQA)**: Gray dashed line.
7. **Q-Anchored (NQ)**: Pink dotted line.
---
### Detailed Analysis
#### Llama-3.2-1B (Left Panel)
- **Q-Anchored (PopQA)**: Starts at 0, dips to ~-40 at layer 5, rises to ~-20 at layer 10, and ends at ~-30.
- **A-Anchored (PopQA)**: Starts at 0, dips to ~-20 at layer 5, rises to ~-10 at layer 10, and ends at ~-15.
- **Q-Anchored (TriviaQA)**: Starts at 0, dips to ~-30 at layer 5, rises to ~-10 at layer 10, and ends at ~-20.
- **A-Anchored (TriviaQA)**: Starts at 0, dips to ~-25 at layer 5, rises to ~-15 at layer 10, and ends at ~-20.
- **Q-Anchored (HotpotQA)**: Starts at 0, dips to ~-35 at layer 5, rises to ~-15 at layer 10, and ends at ~-25.
- **A-Anchored (HotpotQA)**: Starts at 0, dips to ~-25 at layer 5, rises to ~-10 at layer 10, and ends at ~-15.
#### Llama-3.2-3B (Right Panel)
- **Q-Anchored (PopQA)**: Starts at 0, dips to ~-40 at layer 5, rises to ~-20 at layer 10, and ends at ~-30.
- **A-Anchored (PopQA)**: Starts at 0, dips to ~-20 at layer 5, rises to ~-10 at layer 10, and ends at ~-15.
- **Q-Anchored (TriviaQA)**: Starts at 0, dips to ~-30 at layer 5, rises to ~-10 at layer 10, and ends at ~-20.
- **A-Anchored (TriviaQA)**: Starts at 0, dips to ~-25 at layer 5, rises to ~-15 at layer 10, and ends at ~-20.
- **Q-Anchored (HotpotQA)**: Starts at 0, dips to ~-35 at layer 5, rises to ~-15 at layer 10, and ends at ~-25.
- **A-Anchored (HotpotQA)**: Starts at 0, dips to ~-25 at layer 5, rises to ~-10 at layer 10, and ends at ~-15.
- **Q-Anchored (NQ)**: Starts at 0, dips to ~-40 at layer 5, rises to ~-20 at layer 10, and ends at ~-30.
---
### Key Observations
1. **Q-Anchored vs. A-Anchored**:
- Q-Anchored models (e.g., PopQA, TriviaQA, HotpotQA) consistently show larger ΔP decreases compared to A-Anchored models.
- Example: In Llama-3.2-1B, Q-Anchored PopQA drops to ~-40, while A-Anchored PopQA only reaches ~-20.
2. **Model Size Impact**:
- The 3B model (right panel) exhibits more pronounced ΔP decreases, especially for Q-Anchored strategies.
- Example: Q-Anchored NQ in the 3B model drops to ~-40, the lowest value across all lines.
3. **Layer Trends**:
- ΔP decreases sharply in early layers (e.g., layer 5) and stabilizes or slightly recovers in later layers (e.g., layer 10–15/25).
- The 3B model shows more variability in recovery (e.g., Q-Anchored NQ recovers to ~-20 at layer 10 but drops again to ~-30 at layer 25).
---
### Interpretation
- **Anchoring Strategy**: Q-Anchored models (question-based anchoring) experience greater performance degradation (ΔP) compared to A-Anchored models (answer-based anchoring). This suggests that answer anchoring may be more effective for maintaining performance across layers.
- **Model Complexity**: The 3B model (larger) shows more severe ΔP drops, indicating that increased model size amplifies the impact of anchoring strategies.
- **NQ Anchoring**: The Q-Anchored (NQ) line in the 3B model demonstrates the most drastic ΔP decrease, highlighting the critical role of question anchoring in mitigating performance loss.
- **Layer-Specific Behavior**: Early layers (e.g., layer 5) are more sensitive to anchoring strategies, while later layers show partial recovery, possibly due to model adaptation or optimization.
The data underscores the importance of anchoring strategies in balancing performance across layers, with Q-Anchored models being more vulnerable to degradation, particularly in larger models.