## Diagram: Neuro-Symbolic Integration and Visual Reasoning
### Overview
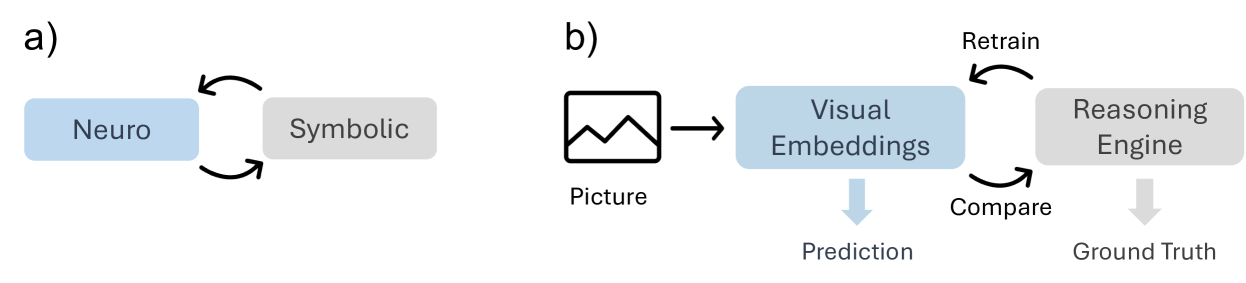
The image presents two diagrams, labeled a) and b), illustrating different approaches to integrating neural and symbolic reasoning. Diagram a) shows a cyclical relationship between "Neuro" and "Symbolic" components. Diagram b) depicts a visual reasoning process, starting with a "Picture" and flowing through "Visual Embeddings" and a "Reasoning Engine," with a feedback loop for retraining.
### Components/Axes
**Diagram a):**
* **Nodes:** "Neuro" (light blue rounded rectangle), "Symbolic" (light gray rounded rectangle)
* **Connections:** Two curved arrows indicating bidirectional interaction between "Neuro" and "Symbolic".
**Diagram b):**
* **Input:** "Picture" (icon of a landscape within a square)
* **Processing Stages:**
* "Visual Embeddings" (light blue rounded rectangle)
* "Reasoning Engine" (light gray rounded rectangle)
* **Outputs:**
* "Prediction" (light blue arrow pointing downwards from "Visual Embeddings")
* "Ground Truth" (light gray arrow pointing downwards from "Reasoning Engine")
* **Feedback Loop:** "Retrain" (curved arrow from "Reasoning Engine" to "Visual Embeddings" via "Compare")
* **Comparison:** "Compare" (text label near the curved arrow connecting "Reasoning Engine" and "Visual Embeddings")
### Detailed Analysis
**Diagram a):**
* The "Neuro" component is represented by a light blue rounded rectangle.
* The "Symbolic" component is represented by a light gray rounded rectangle.
* The bidirectional arrows suggest a continuous exchange or interaction between the neural and symbolic systems.
**Diagram b):**
* The "Picture" is the initial input, represented by a landscape icon.
* "Visual Embeddings" transforms the picture into a numerical representation.
* "Reasoning Engine" uses these embeddings to perform reasoning.
* "Prediction" is the output of the visual reasoning process.
* "Ground Truth" represents the actual correct answer or label.
* The "Compare" step assesses the difference between the "Prediction" and "Ground Truth."
* The "Retrain" loop uses this comparison to update the "Visual Embeddings" and/or "Reasoning Engine."
### Key Observations
* Diagram a) emphasizes the interaction between neural and symbolic systems.
* Diagram b) illustrates a visual reasoning pipeline with a feedback mechanism for improvement.
* The use of different colors (light blue and light gray) might indicate different types of processing or components.
### Interpretation
The diagrams illustrate two key aspects of integrating neural and symbolic approaches. Diagram a) highlights the potential for mutual reinforcement between neural and symbolic systems, where each can inform and improve the other. Diagram b) presents a specific application of this integration in visual reasoning, where visual information is processed and reasoned about, with a feedback loop to refine the process based on ground truth. The visual reasoning pipeline involves transforming a picture into visual embeddings, using a reasoning engine to make predictions, and comparing these predictions to the ground truth to retrain the system. This suggests an iterative process of learning and improvement in visual reasoning tasks.