## Conceptual Diagram: Few-shot vs. Zero-shot Learning Representations
### Overview
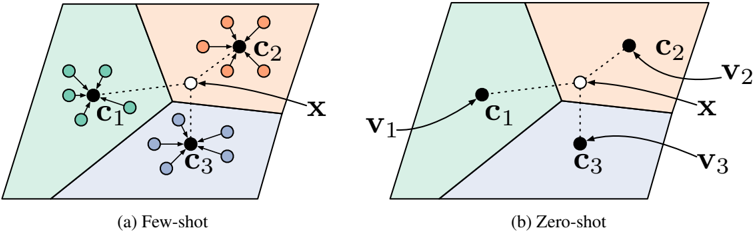
This image presents two side-by-side conceptual diagrams illustrating the difference between "Few-shot" and "Zero-shot" learning paradigms within a shared feature space. The space is partitioned into three distinct regions (colored green, orange, and blue), representing different classes. The diagrams contrast how class prototypes (centroids) are established: via observed data samples in Few-shot learning, and via semantic vectors in Zero-shot learning.
### Components/Axes
* **Spatial Layout:** Both diagrams share an identical 2D feature space divided into three Voronoi-like regions:
* **Left (Green):** Associated with centroid `c1`.
* **Top-Right (Orange):** Associated with centroid `c2`.
* **Bottom-Right (Blue):** Associated with centroid `c3`.
* **Common Elements:**
* **`x` (White Circle):** Located near the center of the diagram, at the intersection of the three regions. This represents a query point to be classified.
* **`c1`, `c2`, `c3` (Black Circles):** Represent the class prototypes or centroids.
* **Dashed Lines:** Connect the query point `x` to each centroid (`c1`, `c2`, `c3`), indicating distance-based relationships.
* **Panel (a) - Few-shot Specifics:**
* **Small Colored Circles:** Clusters of data points surrounding each centroid.
* **Arrows:** Pointing from the small circles toward the respective centroid, indicating the aggregation of samples to form the prototype.
* **Panel (b) - Zero-shot Specifics:**
* **`v1`, `v2`, `v3`:** Labels with curved arrows pointing to centroids `c1`, `c2`, and `c3` respectively. These represent semantic vectors or embeddings.
### Detailed Analysis
#### Panel (a): Few-shot
* **Visual Trend:** The diagram shows three distinct clusters.
* **Data Points:**
* **`c1` (Green Region):** Surrounded by 5 small green circles. Arrows point from these circles to `c1`.
* **`c2` (Orange Region):** Surrounded by 5 small orange circles. Arrows point from these circles to `c2`.
* **`c3` (Blue Region):** Surrounded by 5 small blue circles. Arrows point from these circles to `c3`.
* **Relationship:** The centroid is visually depicted as the center of mass or representative point derived from the surrounding observed data samples. The query point `x` is positioned such that it is closest to `c1` (based on the visual length of the dashed line), suggesting it would be classified as class 1.
#### Panel (b): Zero-shot
* **Visual Trend:** The clusters of small data points are absent. Instead, the centroids are defined by external vectors.
* **Data Points:**
* **`v1`:** An arrow points from the label `v1` to the centroid `c1`.
* **`v2`:** An arrow points from the label `v2` to the centroid `c2`.
* **`v3`:** An arrow points from the label `v3` to the centroid `c3`.
* **Relationship:** The centroids `c1`, `c2`, and `c3` are not derived from observed data points but are projected into the feature space using the semantic vectors `v1`, `v2`, and `v3`. The query point `x` remains in the same relative position, and the classification logic (distance to centroid) remains identical to the Few-shot model.
### Key Observations
* **Structural Consistency:** The underlying geometry (the regions and the position of `x`) is identical in both diagrams, emphasizing that the classification *mechanism* (distance-based) is the same, while the *input* to that mechanism differs.
* **Source of Truth:** In Few-shot learning, the "truth" is empirical (observed samples). In Zero-shot learning, the "truth" is semantic (vectors/embeddings).
* **Absence of Data:** The most notable difference is the complete removal of the small colored circles in the Zero-shot diagram, visually reinforcing the "zero" aspect of the learning paradigm (no training samples).
### Interpretation
This diagram effectively visualizes the transition from empirical learning to semantic learning.
* **Few-shot Learning:** Demonstrates that the model learns to classify by observing a small number of examples. The centroid is an emergent property of the data distribution.
* **Zero-shot Learning:** Demonstrates that the model classifies by mapping semantic concepts (like word embeddings or attributes) into the same feature space as the query point. The centroid is a projected property of the semantic vector.
* **Why it matters:** This comparison highlights that both methods rely on a shared feature space. The diagram suggests that if a model can learn to align semantic vectors (`v`) with the feature space, it can perform classification without ever having seen a single training example for that specific class, provided the semantic vector is sufficiently descriptive.