## Diagram: Few-shot vs Zero-shot Classification Models
### Overview
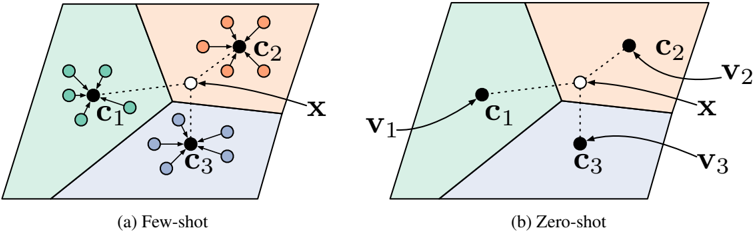
The image presents two comparative diagrams illustrating conceptual differences between few-shot and zero-shot learning approaches. Both diagrams use geometric shapes (triangles) divided into colored regions (green, orange, blue) to represent different components or categories. Central nodes (C1, C2, C3) and vectors (V1, V2, V3) are connected through directional arrows, suggesting relationships between elements.
### Components/Axes
**Diagram (a) Few-shot:**
- **Regions:**
- Green triangle (left): Contains C1 with 4 green nodes connected via dotted lines
- Orange triangle (top): Contains C2 with 3 orange nodes connected via dotted lines
- Blue triangle (bottom): Contains C3 with 3 blue nodes connected via dotted lines
- **Central Node:** White circle labeled "X" at the intersection of all regions
- **Connections:** Dotted lines from X to C1, C2, C3
**Diagram (b) Zero-shot:**
- **Regions:** Same color-coded triangles as (a)
- **Central Node:** White circle labeled "X" at the intersection
- **Vectors:** Solid arrows labeled V1, V2, V3 pointing from X to C1, C2, C3 respectively
- **Additional Elements:** Dashed lines connecting X to C1, C2, C3
### Detailed Analysis
**Few-shot Diagram (a):**
- C1 (green) has 4 connected nodes (likely training examples)
- C2 (orange) has 3 connected nodes
- C3 (blue) has 3 connected nodes
- All connections to X are dotted, suggesting uncertain or probabilistic relationships
**Zero-shot Diagram (b):**
- Vectors V1-V3 show directional influence from X to each C
- Solid arrows indicate stronger, more defined relationships
- Dashed lines maintain conceptual connections from X to all Cs
### Key Observations
1. **Connection Types:** Few-shot uses dotted lines (uncertainty), zero-shot uses solid vectors (certainty)
2. **Node Distribution:** Few-shot shows more nodes per category (C1 has 4 vs C2/C3 with 3)
3. **Spatial Relationships:** Both diagrams share identical regional structure but differ in connection types
4. **Vector Directionality:** Zero-shot explicitly shows directional influence from X to categories
### Interpretation
The diagrams illustrate a progression from exploratory (few-shot) to definitive (zero-shot) learning paradigms:
- **Few-shot (a):** Represents initial model exploration where relationships between central node X and categories (C1-C3) are uncertain, shown by dotted connections. The varying number of nodes per category suggests asymmetric training data distribution.
- **Zero-shot (b):** Demonstrates a matured model where X exerts directional influence (via vectors V1-V3) on all categories, indicating learned relationships. The maintained dashed lines suggest retained conceptual connections despite more defined vector relationships.
The color-coded regions likely represent different semantic categories or feature spaces. The transition from dotted to solid connections implies that zero-shot learning resolves uncertainties present in few-shot approaches through learned vector representations. The consistent regional structure across both diagrams suggests these models share foundational architecture but differ in their operational phases or training stages.