## Line Chart: 1-NN Accuracy vs. Representation Size
### Overview
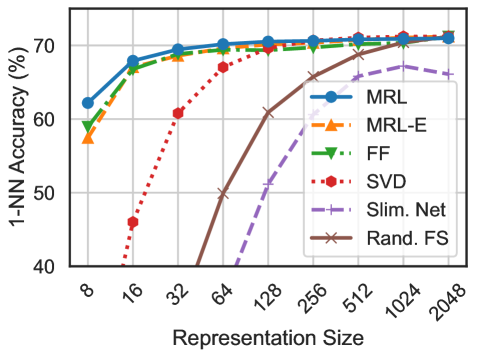
This image presents a line chart illustrating the relationship between representation size and 1-Nearest Neighbor (1-NN) accuracy for six different methods. The chart displays how accuracy changes as the representation size increases, ranging from 8 to 2048.
### Components/Axes
* **X-axis:** Representation Size (scaled logarithmically). Markers are present at 8, 16, 32, 64, 128, 256, 512, 1024, and 2048.
* **Y-axis:** 1-NN Accuracy (%). The scale ranges from 40% to 70%.
* **Legend:** Located in the top-right corner, identifying six data series:
* MRL (Blue, solid line with circle markers)
* MRL-E (Orange, dashed line with square markers)
* FF (Green, dotted line with triangle markers)
* SVD (Red, dotted line with diamond markers)
* Slim. Net (Purple, dashed line with plus markers)
* Rand. FS (Brown, solid line with cross markers)
* **Gridlines:** Present to aid in reading values.
### Detailed Analysis
Here's a breakdown of each data series, noting trends and approximate values:
* **MRL (Blue):** The line starts at approximately 68% accuracy at a representation size of 8, increases slightly to around 71% at 16, plateaus around 72% from 32 to 2048.
* **MRL-E (Orange):** Starts at approximately 58% at 8, rises to around 68% at 16, then plateaus around 70% from 32 to 2048.
* **FF (Green):** Begins at approximately 64% at 8, increases to around 69% at 16, and then plateaus around 71% from 32 to 2048.
* **SVD (Red):** Shows a significant increase in accuracy with increasing representation size. Starts at approximately 43% at 8, rises to around 59% at 16, 68% at 64, 71% at 128, and plateaus around 72% from 256 to 2048.
* **Slim. Net (Purple):** Starts at approximately 60% at 8, increases to around 65% at 16, and then rises more steeply to around 68% at 128, and plateaus around 70% from 256 to 2048.
* **Rand. FS (Brown):** Starts at approximately 40% at 8, increases rapidly to around 60% at 64, 68% at 128, and plateaus around 71% from 256 to 2048.
### Key Observations
* All methods achieve relatively high accuracy (above 70%) at larger representation sizes (256 and above).
* SVD and Rand. FS show the most significant improvement in accuracy as representation size increases, particularly in the lower range (8-128).
* MRL, MRL-E, and FF exhibit relatively stable accuracy across all representation sizes, with minimal improvement beyond a size of 32.
* The performance gap between the methods narrows as representation size increases.
### Interpretation
The data suggests that increasing the representation size generally improves 1-NN accuracy, but the rate of improvement varies significantly depending on the method used. Methods like SVD and Rand. FS, which initially have lower accuracy, benefit the most from larger representation sizes. This indicates that these methods require more data to effectively capture the underlying patterns in the data. Conversely, MRL, MRL-E, and FF achieve high accuracy even with small representation sizes, suggesting they are more efficient at extracting relevant features. The plateauing of accuracy at larger representation sizes for all methods suggests a point of diminishing returns, where further increasing the representation size does not lead to substantial gains in performance. This could be due to overfitting or the inherent limitations of the 1-NN algorithm. The logarithmic scale on the x-axis emphasizes the importance of the initial increase in representation size for methods like SVD and Rand. FS, where the largest gains are observed in the lower range.