## Line Chart: 1-NN Accuracy vs. Representation Size for Various Methods
### Overview
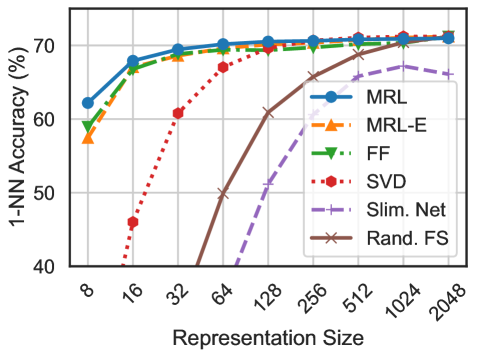
This image is a line chart comparing the performance of six different dimensionality reduction or representation learning methods. The chart plots the 1-Nearest Neighbor (1-NN) classification accuracy (as a percentage) against the size of the learned representation (a dimensionality or feature count). The x-axis uses a logarithmic scale.
### Components/Axes
* **Chart Type:** Multi-line chart with markers.
* **Y-Axis:**
* **Label:** `1-NN Accuracy (%)`
* **Scale:** Linear, ranging from 40 to 70+.
* **Major Ticks:** 40, 50, 60, 70.
* **X-Axis:**
* **Label:** `Representation Size`
* **Scale:** Logarithmic (base 2).
* **Major Ticks (Values):** 8, 16, 32, 64, 128, 256, 512, 1024, 2048.
* **Legend:** Located in the top-right quadrant of the chart area. It contains six entries, each with a unique line style, color, and marker.
1. **MRL:** Solid blue line with circular markers.
2. **MRL-E:** Dashed orange line with upward-pointing triangle markers.
3. **FF:** Dash-dot green line with downward-pointing triangle markers.
4. **SVD:** Dotted red line with circular markers.
5. **Slim. Net:** Dashed purple line with plus sign markers.
6. **Rand. FS:** Solid brown line with 'x' markers.
* **Grid:** A light gray grid is present, aligned with the major ticks on both axes.
### Detailed Analysis
**Trend Verification & Data Point Extraction (Approximate Values):**
1. **MRL (Blue, Solid, Circles):**
* **Trend:** Starts highest, increases rapidly, then plateaus near the top.
* **Points:** Size 8: ~62%, Size 16: ~68%, Size 32: ~69%, Size 64: ~70%, Size 128: ~70.5%, Size 256: ~71%, Size 512: ~71%, Size 1024: ~71%, Size 2048: ~71%.
2. **MRL-E (Orange, Dashed, Up-Triangles):**
* **Trend:** Follows a very similar trajectory to MRL, starting slightly lower and converging with it.
* **Points:** Size 8: ~57%, Size 16: ~67%, Size 32: ~68.5%, Size 64: ~69.5%, Size 128: ~70%, Size 256: ~70.5%, Size 512: ~71%, Size 1024: ~71%, Size 2048: ~71%.
3. **FF (Green, Dash-Dot, Down-Triangles):**
* **Trend:** Starts lower than MRL/MRL-E, increases steadily, and converges with them at larger sizes.
* **Points:** Size 8: ~59%, Size 16: ~67%, Size 32: ~68%, Size 64: ~69%, Size 128: ~70%, Size 256: ~70.5%, Size 512: ~71%, Size 1024: ~71%, Size 2048: ~71%.
4. **SVD (Red, Dotted, Circles):**
* **Trend:** Starts very low, exhibits the steepest and most consistent upward slope, and eventually converges with the top group.
* **Points:** Size 8: <40% (off-chart low), Size 16: ~46%, Size 32: ~61%, Size 64: ~67%, Size 128: ~69.5%, Size 256: ~70.5%, Size 512: ~71%, Size 1024: ~71%, Size 2048: ~71%.
5. **Slim. Net (Purple, Dashed, Plus Signs):**
* **Trend:** Begins at a larger size (128), increases, but then appears to plateau or slightly decline at the largest sizes, remaining below the top cluster.
* **Points:** Size 128: ~50%, Size 256: ~63%, Size 512: ~66%, Size 1024: ~66%, Size 2048: ~65.5%.
6. **Rand. FS (Brown, Solid, 'x' Marks):**
* **Trend:** Begins at size 64, increases sharply, and converges with the top group at the largest sizes.
* **Points:** Size 64: ~50%, Size 128: ~61%, Size 256: ~67%, Size 512: ~70%, Size 1024: ~71%, Size 2048: ~71%.
### Key Observations
1. **Convergence at Large Sizes:** For representation sizes of 512 and above, five of the six methods (MRL, MRL-E, FF, SVD, Rand. FS) achieve nearly identical accuracy, clustering tightly around 71%.
2. **Performance Hierarchy at Small Sizes:** At the smallest representation size (8), there is a clear performance hierarchy: MRL > FF > MRL-E. SVD performs extremely poorly at small sizes.
3. **SVD's Dramatic Improvement:** SVD shows the most significant relative improvement, going from the worst performer at size 16 to being among the best at size 256 and beyond.
4. **Slim. Net's Underperformance:** "Slim. Net" is the only method that does not converge with the top group. Its accuracy peaks around size 512 and then shows a slight downward trend.
5. **Rand. FS's Late Start but Strong Finish:** Random Feature Selection ("Rand. FS") requires a larger initial size (64) to become competitive but ultimately matches the top performers.
### Interpretation
This chart demonstrates the trade-off between representation size (model complexity or feature count) and downstream task performance (1-NN accuracy) for different feature learning/selection techniques.
* **Efficiency:** Methods like **MRL** and **MRL-E** are highly efficient, achieving near-peak accuracy with very small representation sizes (e.g., 16-32). This suggests they learn highly informative features early on.
* **Data Hunger:** **SVD** (likely Principal Component Analysis) is "data-hungry" in terms of dimensionality; it requires a substantial number of components to capture enough variance for good classification, but it scales effectively.
* **Diminishing Returns:** All methods exhibit diminishing returns. After a representation size of approximately 256, adding more dimensions yields minimal accuracy gains for most methods, indicating a performance ceiling for the given task and 1-NN classifier.
* **Methodological Insight:** The convergence of most methods at large sizes suggests that with enough dimensions, the specific algorithm for obtaining the representation becomes less critical for this particular task. The outlier behavior of **Slim. Net** might indicate an architectural constraint or a different optimization objective that doesn't align perfectly with maximizing 1-NN accuracy at very high dimensions.
* **Practical Implication:** For resource-constrained applications where small models are needed, **MRL** or **MRL-E** would be preferable. If computational resources allow for larger representations, simpler methods like **SVD** or even **Rand. FS** can achieve top-tier performance.