## Line Graph: 1-NN Accuracy vs. Representation Size
### Overview
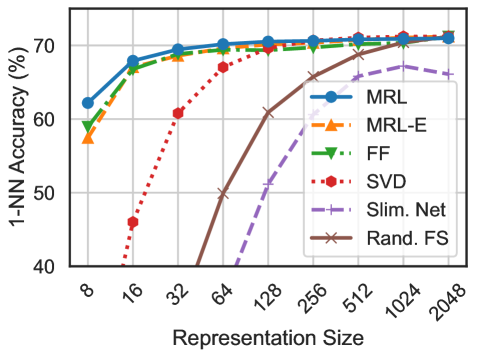
The image is a line graph comparing the 1-NN (1-Nearest Neighbor) accuracy of various algorithms as a function of representation size. The x-axis represents representation size (in powers of 2: 8, 16, 32, ..., 2048), and the y-axis represents accuracy percentage (40% to 70%). Six algorithms are compared: MRL, MRL-E, FF, SVD, Slim. Net, and Rand. FS. Each algorithm is represented by a distinct line style and color.
---
### Components/Axes
- **X-axis (Representation Size)**:
- Labels: 8, 16, 32, 64, 128, 256, 512, 1024, 2048.
- Scale: Logarithmic (powers of 2).
- **Y-axis (1-NN Accuracy (%))**:
- Labels: 40%, 50%, 60%, 70%.
- Scale: Linear (0% to 70%).
- **Legend**:
- Position: Right side of the graph.
- Entries:
- **MRL**: Solid blue line with circles.
- **MRL-E**: Dashed orange line with triangles.
- **FF**: Dotted green line with triangles.
- **SVD**: Dash-dot red line with hexagons.
- **Slim. Net**: Dash-dot purple line with crosses.
- **Rand. FS**: Solid brown line with crosses.
---
### Detailed Analysis
1. **MRL (Solid Blue)**:
- Starts at ~62% accuracy at 8x representation size.
- Increases steadily to ~70% by 32x, then plateaus.
- Maintains ~70% accuracy for larger sizes (64x–2048x).
2. **MRL-E (Dashed Orange)**:
- Starts at ~58% at 8x.
- Rises to ~68% by 32x, then plateaus.
- Slightly lower than MRL for all sizes.
3. **FF (Dotted Green)**:
- Starts at ~59% at 8x.
- Increases to ~69% by 32x, then plateaus.
- Similar performance to MRL but slightly lower.
4. **SVD (Dash-Dot Red)**:
- Starts at ~45% at 8x.
- Sharp increase to ~65% by 32x, then plateaus.
- Highest initial growth rate but lower plateau than MRL/FF.
5. **Slim. Net (Dash-Dot Purple)**:
- Starts at ~55% at 8x.
- Increases to ~67% by 32x, then plateaus.
- Moderate growth rate and lower plateau than MRL/FF.
6. **Rand. FS (Solid Brown)**:
- Starts at ~50% at 8x.
- Rapid increase to ~70% by 32x, then plateaus.
- Matches MRL/FF performance at larger sizes despite slow start.
---
### Key Observations
- **Trend Verification**:
- All algorithms show **increasing accuracy** with larger representation sizes, but the rate of improvement varies.
- **SVD** and **Rand. FS** exhibit the steepest initial growth, while **MRL** and **FF** achieve the highest plateau.
- **MRL-E** and **Slim. Net** have moderate growth and lower plateaus.
- **Notable Patterns**:
- **MRL** and **FF** consistently outperform others at larger sizes.
- **SVD** and **Rand. FS** show strong scalability but require larger representation sizes to reach peak performance.
- **Slim. Net** and **MRL-E** lag behind in both growth and final accuracy.
---
### Interpretation
The data suggests that **MRL** and **FF** are the most effective algorithms for 1-NN tasks, achieving high accuracy even at smaller representation sizes. **SVD** and **Rand. FS** demonstrate strong scalability but require larger data representations to match the performance of MRL/FF. The **Slim. Net** and **MRL-E** algorithms show moderate performance, indicating potential inefficiencies in their design or training. The sharp initial growth of **SVD** and **Rand. FS** implies they may be particularly sensitive to representation size, possibly due to their reliance on specific features or dimensionality reduction techniques. Overall, the graph highlights the trade-off between representation size and algorithmic efficiency in 1-NN tasks.