\n
## Diagram: LLM Self-Training Process
### Overview
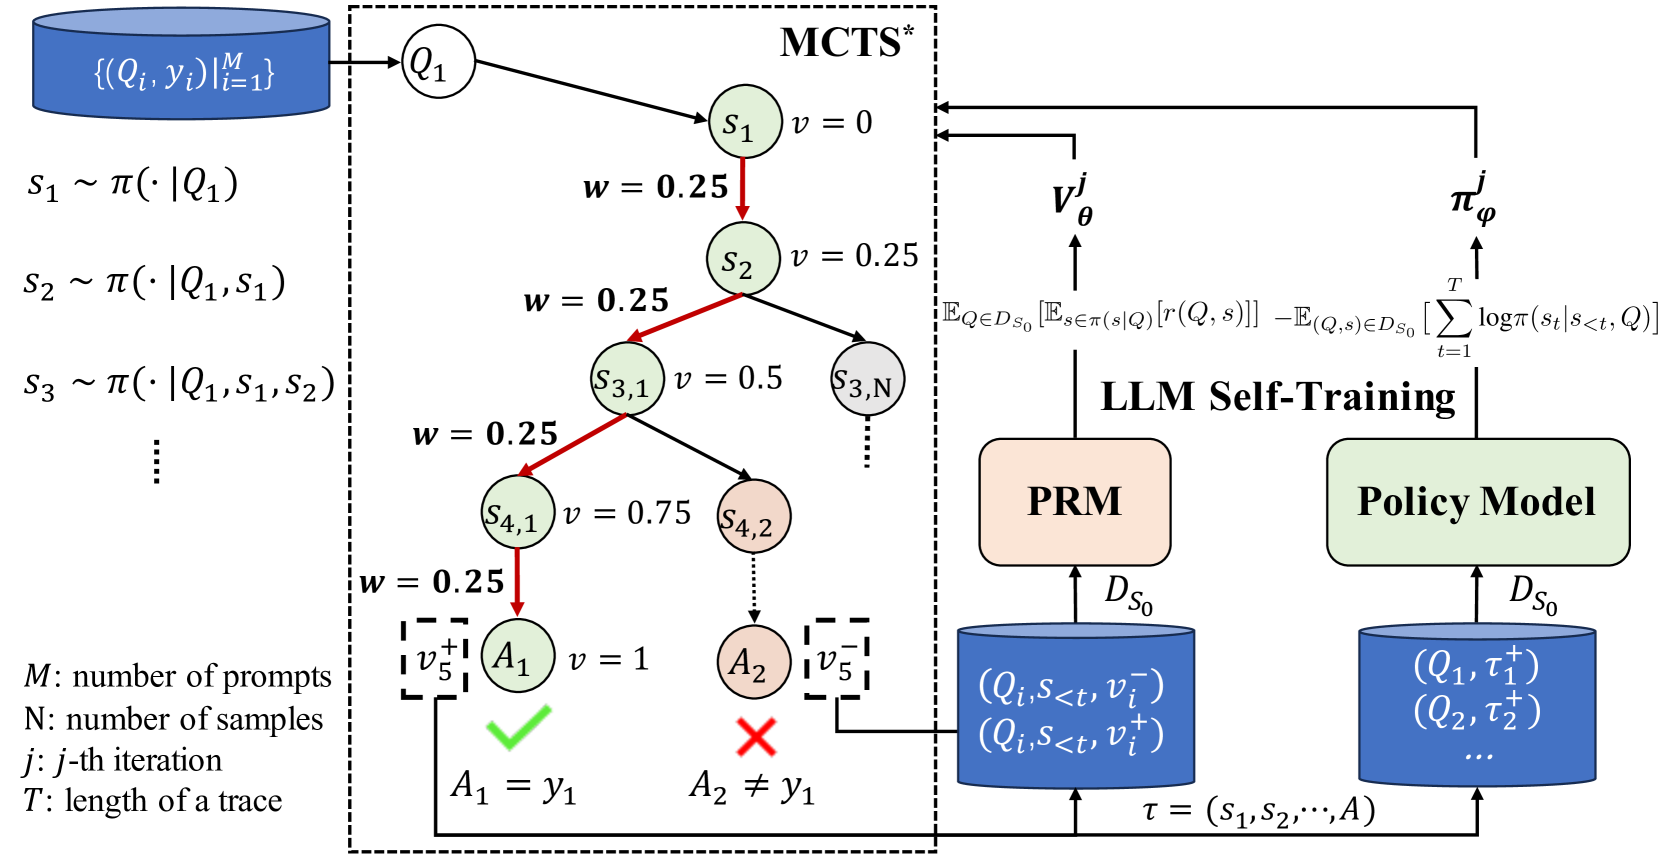
This diagram illustrates the process of LLM Self-Training, incorporating Monte Carlo Tree Search (MCTS) and a Policy Model. The diagram depicts a flow of information from prompt generation to policy improvement, with key components including a Prompt Response Model (PRM) and iterative sampling. The left side shows the MCTS process, while the right side details the LLM self-training loop.
### Components/Axes
The diagram is segmented into three main regions:
1. **MCTS (Monte Carlo Tree Search)**: Located on the left, this section shows the iterative sampling process.
2. **LLM Self-Training**: Located in the center, this section represents the core training loop.
3. **Policy Model & PRM**: Located on the right, this section shows the output of the LLM self-training loop.
Key labels and notations include:
* `{Qᵢ, γᵢ} |ᵢ₌₁ᴹ`: Set of prompts and values.
* `s₁ ~ π(Q₁)`: Sampling of state s₁ based on policy π given prompt Q₁.
* `s₂ ~ π(Q₁, s₁)`: Sampling of state s₂ based on policy π given prompt Q₁ and state s₁.
* `s₃ ~ π(Q₁, s₁, s₂)`: Sampling of state s₃ based on policy π given prompt Q₁, s₁, and s₂.
* `M`: Number of prompts.
* `N`: Number of samples.
* `j`: j-th iteration.
* `T`: Length of a trace.
* `v`: Value estimate.
* `w`: Weight.
* `Qᵢ`: Prompt.
* `γᵢ`: Value.
* `sᵢ`: State.
* `π(θ)`: Policy.
* `τ`: Trace.
* `Dₛ₀`: Dataset.
* `vⱼ`: Value function.
* `A₁ = γ₁`: Acceptance condition.
* `A₂ ≠ γ₁`: Rejection condition.
* `Qᵢ, S<t>, v<t>`: Prompt, state, and value at time t.
* `Qᵢ, S<t>, v<t>`: Prompt, state, and value at time t.
* `E[r(Q, s)]`: Expected reward.
* `logπ(s(t) | Q)`: Log probability of state given prompt.
### Detailed Analysis or Content Details
The MCTS section shows a series of states `s₁`, `s₂`, `s₃`, `s₄,₁`, `s₄,₂`, and `s₅,₁` connected by arrows representing the sampling process. The values `v` are associated with each state, starting at 0 for `s₁` and increasing to 1 for `s₅,₁`. The weights `w` are consistently 0.25 for `s₁` through `s₄,₁`, and `s₄,₂`.
The LLM Self-Training section shows a feedback loop. The value function `vⱼ` is calculated based on an expected reward and a log probability term. This value is then used to update the policy model `π(θ)`. The policy model outputs a trace `τ` which is then used to generate a dataset `Dₛ₀` for the Prompt Response Model (PRM). The PRM also outputs a dataset `Dₛ₀` which is fed back into the Policy Model.
The final states `A₁` and `A₂` are represented by a green checkmark and a red 'X', respectively, indicating acceptance or rejection based on the conditions `A₁ = γ₁` and `A₂ ≠ γ₁`.
### Key Observations
* The value `v` increases as the MCTS process progresses, suggesting a refinement of the state evaluation.
* The consistent weight `w` indicates a uniform exploration strategy in the initial stages of MCTS.
* The feedback loop in the LLM Self-Training section highlights the iterative nature of the process.
* The acceptance/rejection criteria based on `A₁` and `A₂` suggest a validation step in the training process.
* The diagram shows a clear separation between the MCTS exploration phase and the LLM training phase.
### Interpretation
This diagram illustrates a reinforcement learning approach to LLM training. The MCTS component is used to explore the space of possible prompts and states, generating data that is then used to train the Policy Model. The Policy Model learns to predict the best actions (prompts) to take in order to maximize the expected reward. The PRM acts as a bridge between the policy and the data generation process. The iterative nature of the self-training loop allows the LLM to continuously improve its performance. The acceptance/rejection criteria suggest a mechanism for filtering out low-quality samples and ensuring the stability of the training process. The diagram suggests a sophisticated approach to LLM training that combines the benefits of both exploration (MCTS) and exploitation (Policy Model). The use of value functions and log probabilities indicates a probabilistic framework for decision-making. The overall goal is to create an LLM that can generate high-quality responses to a wide range of prompts.