## Reward vs Steps (Mean Min/Max): Line Chart with Confidence Intervals
### Overview
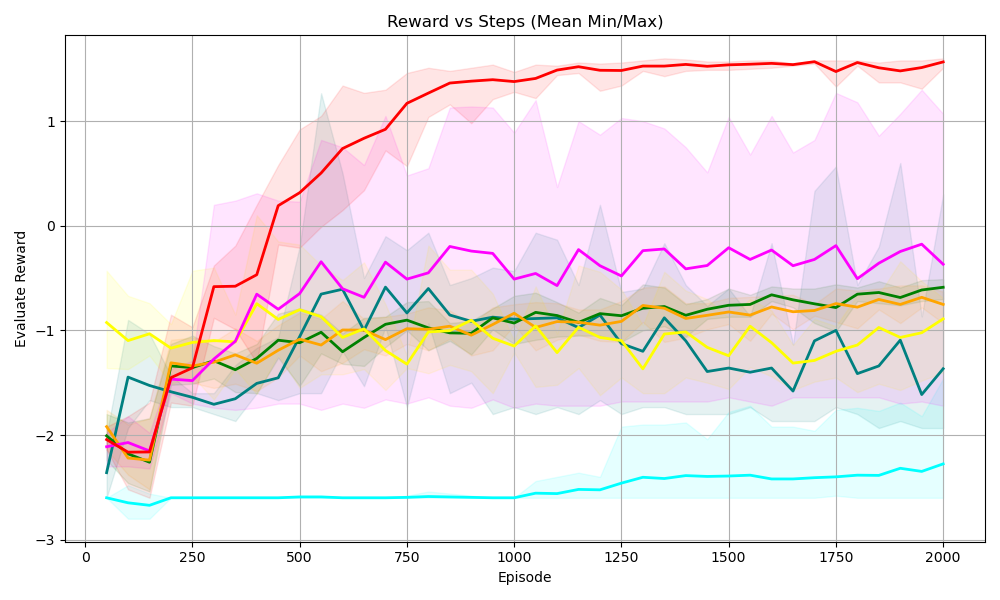
This is a line chart tracking **Evaluate Reward** across training **Episodes** (steps), displaying mean reward values for 7 distinct series, each paired with a shaded region representing the minimum/maximum reward range (confidence interval) for that series. The chart spans 0 to 2000 episodes on the horizontal axis, and reward values from -3 to +1.5 on the vertical axis.
### Components/Axes
- **Title**: "Reward vs Steps (Mean Min/Max)" (top-center of the chart)
- **X-axis**: Labeled *Episode*, linear scale with major ticks at 0, 250, 500, 750, 1000, 1250, 1500, 1750, 2000.
- **Y-axis**: Labeled *Evaluate Reward*, linear scale with major ticks at -3, -2, -1, 0, 1.
- **Series (Colored Lines + Shaded Bands)**:
1. Red line (topmost, light red shaded band)
2. Magenta (pink) line (second-highest, light pink shaded band)
3. Dark green line (middle, light green shaded band)
4. Orange line (middle, light orange shaded band)
5. Yellow line (middle, light yellow shaded band)
6. Dark teal (blue-green) line (lower-middle, light teal shaded band)
7. Cyan (bright blue) line (bottommost, light cyan shaded band)
### Detailed Analysis
1. **Red Line (Top Series)**
- Trend: Starts at ~-2.1 (episode 0), rises steeply until ~episode 750, then plateaus with minor fluctuations, ending at ~1.4 (episode 2000).
- Key points: Crosses 0 reward at ~episode 350, reaches 1 reward at ~episode 600, peaks at ~1.5 (episode 2000). Shaded band is narrow, indicating low performance variance.
2. **Magenta Line**
- Trend: Starts at ~-2.2 (episode 0), rises to ~-0.5 by episode 500, then fluctuates between -0.5 and 0 for the remainder, ending at ~-0.3 (episode 2000).
- Key points: Shaded band is very wide, indicating high variance (ranges from ~-1.5 to +1.5 at later episodes).
3. **Dark Green Line**
- Trend: Starts at ~-2.0 (episode 0), rises to ~-1.0 by episode 500, then fluctuates between -1.0 and -0.5, ending at ~-0.6 (episode 2000).
- Key points: Shaded band is moderate, variance ranges ~-1.8 to 0 at later episodes.
4. **Orange Line**
- Trend: Starts at ~-2.0 (episode 0), rises to ~-1.0 by episode 500, then fluctuates between -1.0 and -0.7, ending at ~-0.7 (episode 2000).
- Key points: Shaded band is moderate, variance ranges ~-1.7 to 0 at later episodes.
5. **Yellow Line**
- Trend: Starts at ~-1.0 (episode 0), dips to ~-1.5 at episode 250, then fluctuates between -1.5 and -0.8, ending at ~-0.9 (episode 2000).
- Key points: Shaded band is moderate, variance ranges ~-2.0 to 0 at later episodes.
6. **Dark Teal Line**
- Trend: Starts at ~-2.3 (episode 0), rises to ~-1.2 by episode 500, then fluctuates between -1.5 and -0.8, ending at ~-1.3 (episode 2000).
- Key points: Shaded band is moderate, variance ranges ~-2.2 to 0 at later episodes.
7. **Cyan Line (Bottom Series)**
- Trend: Starts at ~-2.7 (episode 0), rises slightly to ~-2.5 by episode 250, then plateaus with minor fluctuations, ending at ~-2.3 (episode 2000).
- Key points: Shaded band is narrow, indicating low variance; remains the lowest-performing series throughout.
### Key Observations
- The red line is the only series to achieve positive reward, with the steepest initial improvement.
- The cyan line shows the least improvement, staying near the bottom of the reward scale.
- The magenta line has the widest variance (shaded band), indicating the most inconsistent performance.
- All series show an initial upward trend (improvement) in the first 500 episodes, then most plateau or fluctuate.
- The red line's narrow shaded band means its performance is the most consistent once it plateaus.
### Interpretation
This chart likely compares the performance of different reinforcement learning agents (or agent configurations) during training, where *Evaluate Reward* measures task success.
- The red agent is the most successful: it learns rapidly, achieves positive reward, and maintains consistent high performance.
- The cyan agent performs the worst, with minimal learning progress.
- The magenta agent has high potential (reaches near 0 reward) but is highly unreliable, with extreme performance swings.
- The middle-tier agents (green, orange, yellow, teal) show moderate learning and consistent, mid-range performance.
The initial steep rise for most agents indicates rapid learning in the early training phase, followed by convergence to a stable policy (plateau). Variance (shaded bands) reflects performance reliability: lower variance means more predictable results.