## Line Chart: Reward vs Steps (Mean Min/Max)
### Overview
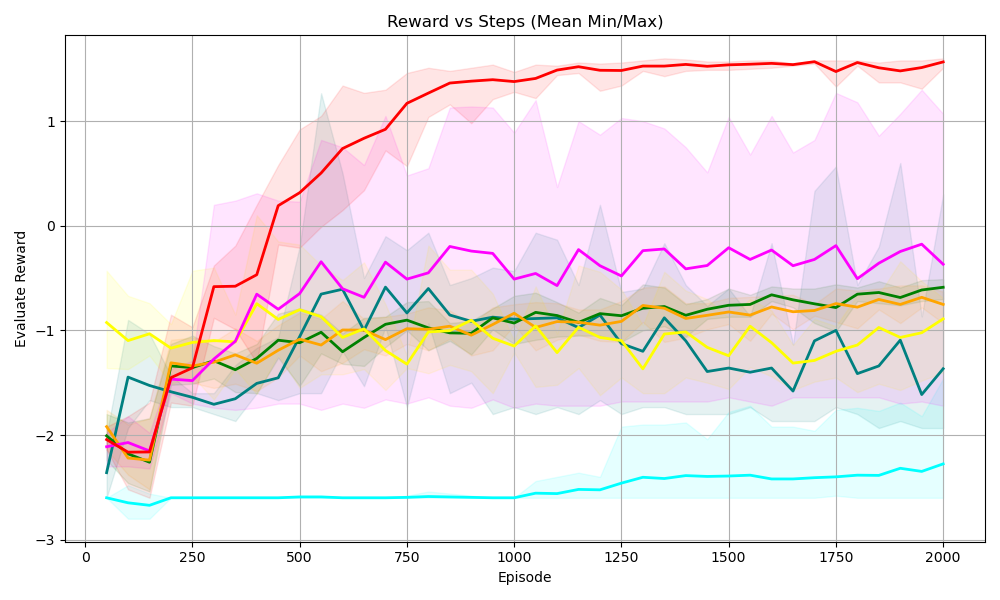
The chart visualizes the evaluation reward performance of multiple agents across 2000 episodes. Each agent is represented by a colored line with a shaded region indicating variability (min/max bounds). The y-axis shows reward values ranging from -3 to 1, while the x-axis tracks episodes from 0 to 2000.
### Components/Axes
- **X-axis (Episode)**: Discrete steps from 0 to 2000, labeled at intervals of 250.
- **Y-axis (Evaluation Reward)**: Continuous scale from -3 to 1, with gridlines at integer values.
- **Legend**: Located on the right, associating colors with agent labels:
- Red: Agent A
- Blue: Agent B
- Green: Agent C
- Yellow: Agent D
- Cyan: Agent E
- **Shaded Regions**: Gray bands around each line represent the min/max variability of rewards.
### Detailed Analysis
1. **Agent A (Red Line)**:
- **Trend**: Starts at ~-2.0 (episode 0), rises sharply to ~1.5 by episode 2000.
- **Variability**: Wide shaded region (spread of ~0.5–1.0) indicates high reward instability early on, narrowing slightly later.
- **Key Point**: Reaches ~1.2 by episode 1000, plateaus near 1.5 post-episode 1500.
2. **Agent B (Blue Line)**:
- **Trend**: Flat line at ~-1.5 throughout all episodes.
- **Variability**: Narrow shaded region (~±0.2), suggesting consistent but low performance.
3. **Agent C (Green Line)**:
- **Trend**: Oscillates between ~-1.0 and ~-0.5, with minor upward drift (~-1.0 to ~-0.8) over time.
- **Variability**: Moderate shaded region (~±0.3), indicating moderate instability.
4. **Agent D (Yellow Line)**:
- **Trend**: Noisy pattern with peaks at ~-0.8 and troughs at ~-1.5, no clear trend.
- **Variability**: Wide shaded region (~±0.5), reflecting high reward inconsistency.
5. **Agent E (Cyan Line)**:
- **Trend**: Steady at ~-2.5 across all episodes.
- **Variability**: Narrow shaded region (~±0.1), indicating stable but poor performance.
### Key Observations
- **Agent A** demonstrates the most significant improvement, achieving the highest reward (~1.5) by the final episode.
- **Agent B** and **Agent E** exhibit the lowest rewards, with Agent E being the most consistently poor performer.
- **Agent C** and **Agent D** show intermediate performance, with Agent C having slightly better stability than Agent D.
- The shaded regions confirm that Agent A’s rewards are the most variable early on, while Agent E’s rewards are the most stable.
### Interpretation
The chart suggests a competitive hierarchy among agents:
- **Agent A** outperforms others, with a clear upward trajectory indicating effective learning or adaptation.
- **Agent B** and **Agent E** represent baseline or underperforming agents, with no improvement over time.
- **Agent C** and **Agent D** show mixed results, with Agent C’s oscillations potentially indicating exploration or unstable training dynamics.
- The shaded regions highlight the importance of considering variability: Agent A’s wide spread early on suggests high uncertainty, which narrows as performance stabilizes. In contrast, Agent E’s narrow spread indicates consistent but poor outcomes.
This analysis underscores the relationship between episode progression and reward optimization, with Agent A’s success likely tied to adaptive strategies or superior initialization.