## Diagram: Knowledge Graph of Political Relations and Events (Ukraine, 2014)
### Overview
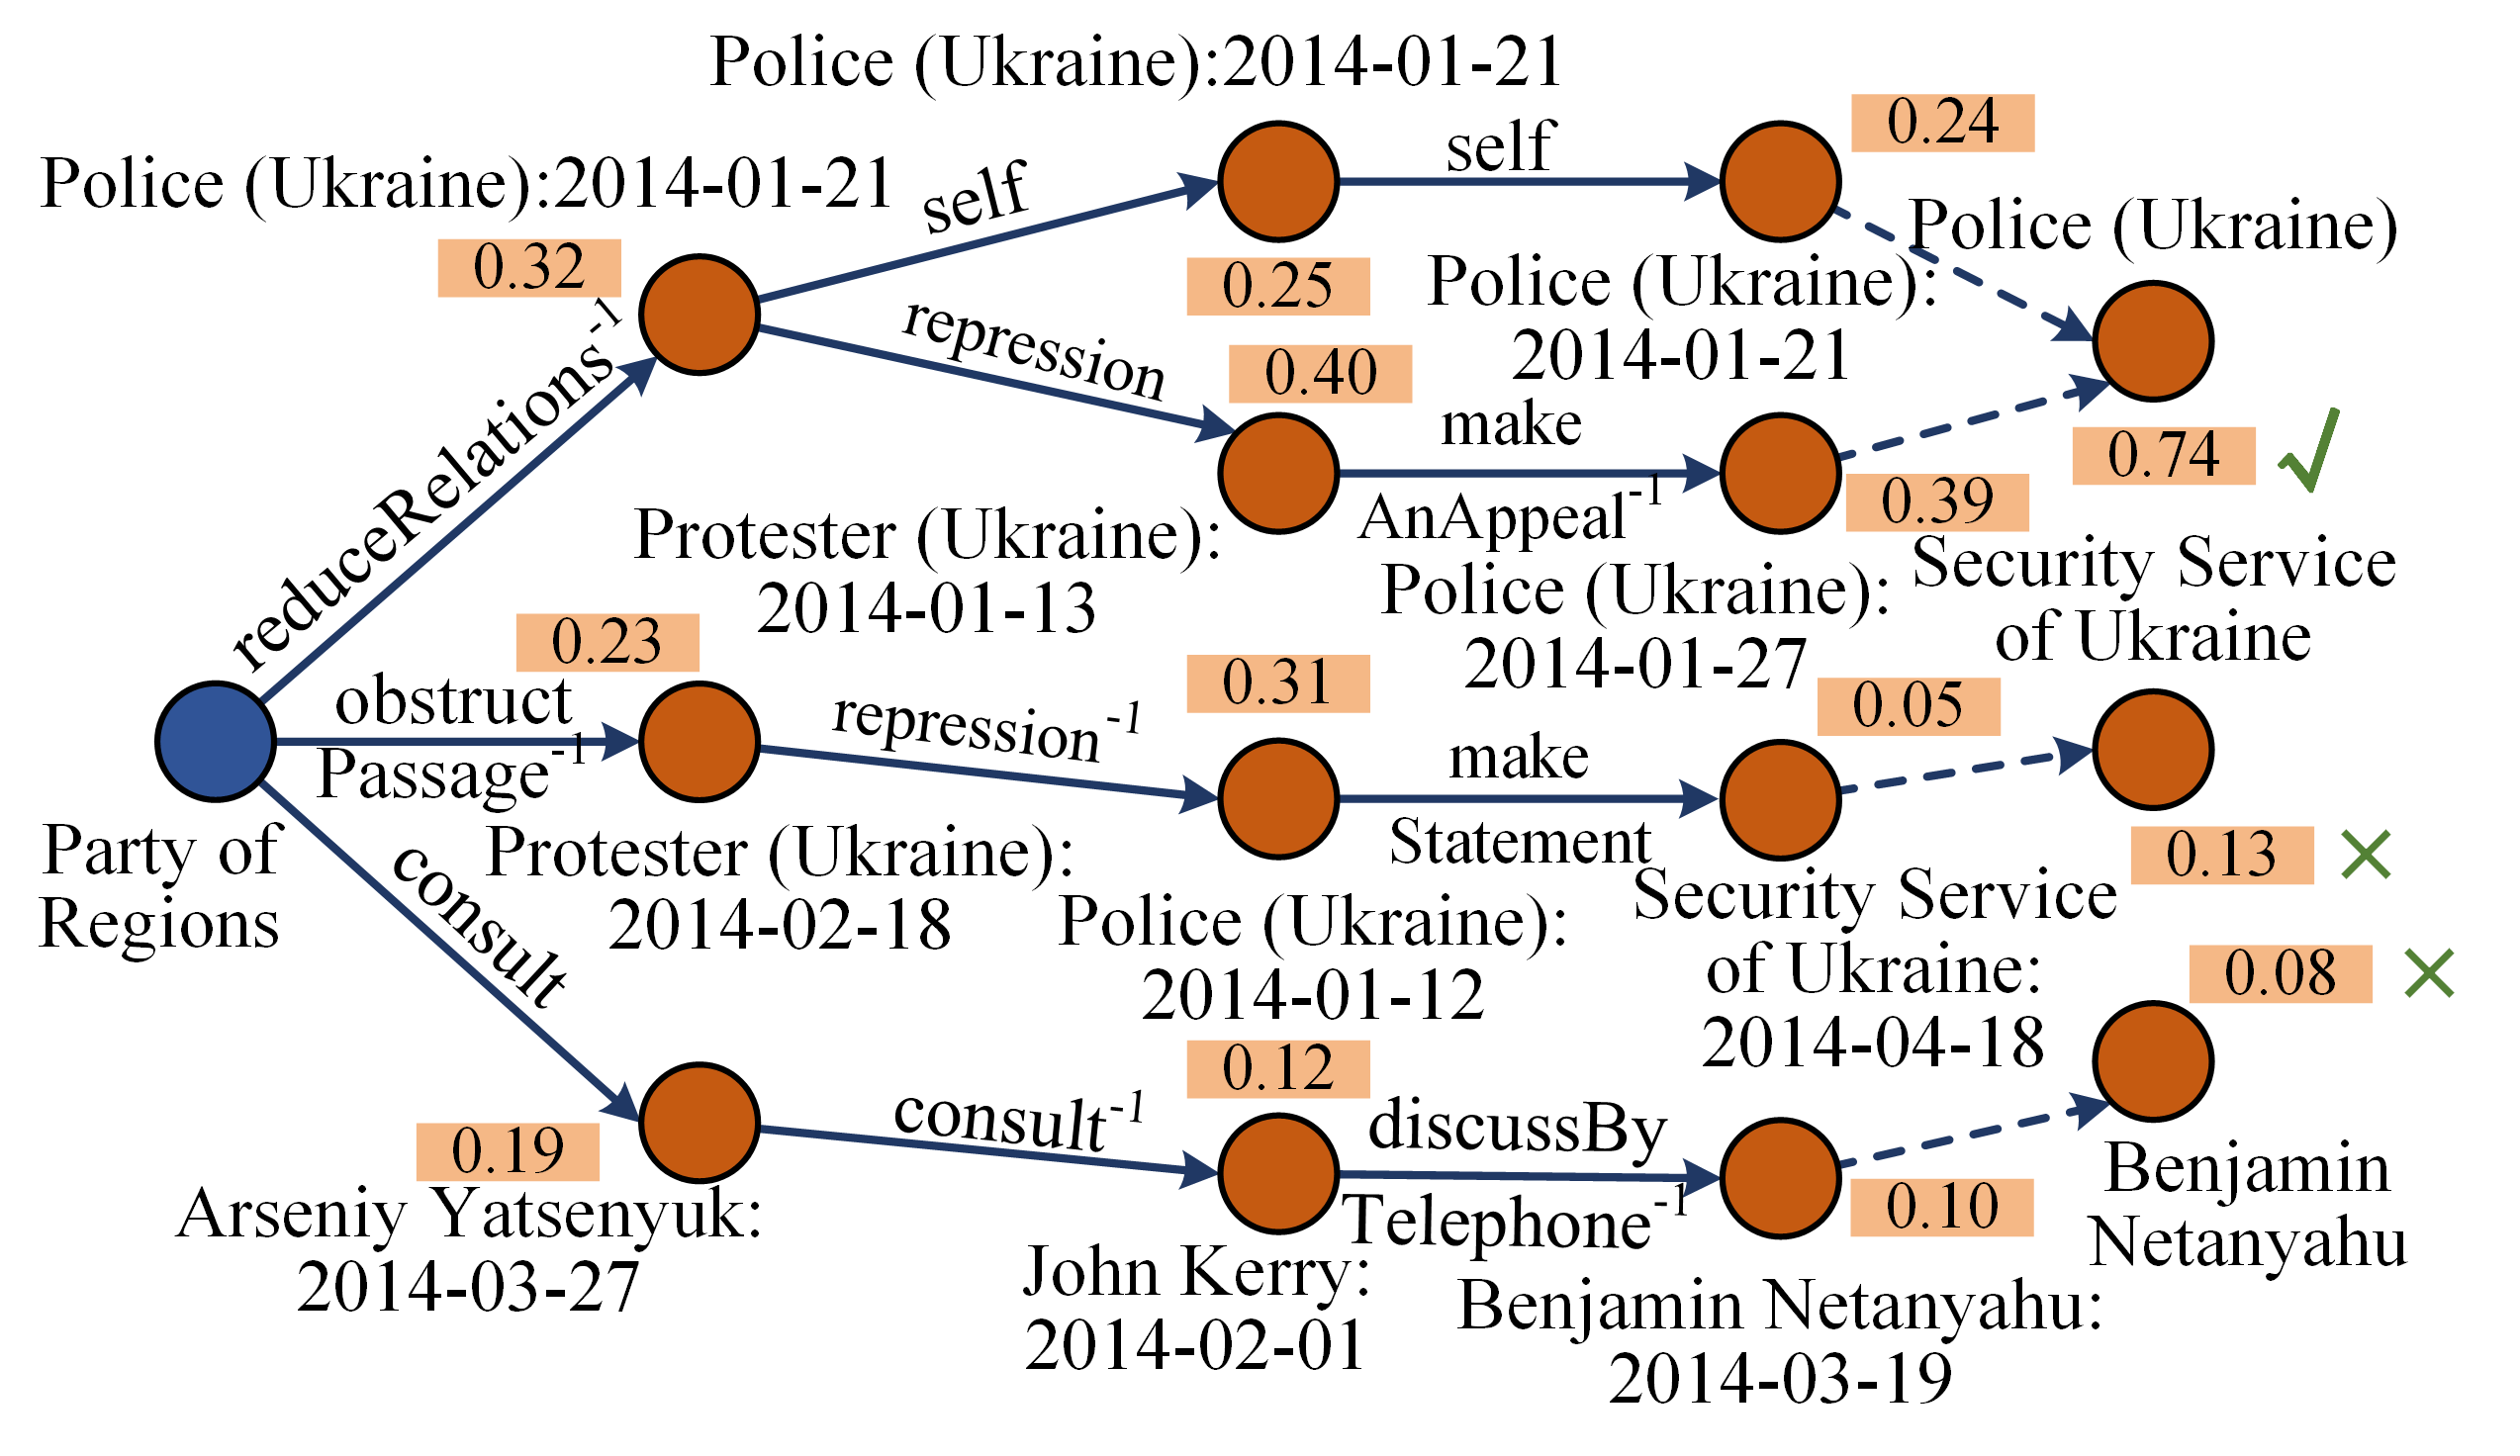
The image displays a directed graph or knowledge graph modeling relationships and interactions between political entities, security forces, and individuals primarily during the Ukrainian political crisis of early 2014. The graph flows generally from left to right, originating from a central entity and branching into multiple interaction pathways. Each node represents an entity with an associated date, and each edge represents a labeled relationship with an associated numerical weight (likely a confidence score or probability). Some terminal relationships are marked with a green checkmark (✓) or a red cross (✗).
### Components/Axes
* **Node Types & Colors:**
* **Central Node (Blue):** "Party of Regions" (no date attached).
* **Entity Nodes (Orange):** All other nodes, representing specific entities on specific dates.
* **Edge Types:**
* **Solid Dark Blue Arrows:** Indicate primary relationships.
* **Dashed Dark Blue Arrows:** Indicate secondary or inferred relationships, typically leading to final entity nodes without dates.
* **Labels & Values:**
* **Node Labels:** Text adjacent to each circle, formatted as `Entity Name: YYYY-MM-DD`.
* **Edge Labels:** Text along the arrows describing the relationship (e.g., "reduceRelations⁻¹", "consult", "self"). Some labels include a superscript "-1", suggesting an inverse relationship.
* **Numerical Weights:** Beige boxes containing decimal numbers (e.g., 0.32, 0.24) placed near the midpoint of edges.
* **Verification Marks:** A green checkmark (✓) and red crosses (✗) appear next to some terminal numerical values.
### Detailed Analysis
The graph originates from the **Party of Regions** node and splits into three primary branches:
**1. Top Branch (Police/Protester Relations):**
* **Path 1.1:** `Party of Regions` →(reduceRelations⁻¹, 0.32)→ `Police (Ukraine):2014-01-21`
* This node splits:
* →(self, 0.25)→ `Police (Ukraine):2014-01-21` →(self, 0.24)→ `Police (Ukraine)` [Dashed arrow]
* →(repression, 0.40)→ `Police (Ukraine):2014-01-21` →(make AnAppeal⁻¹, 0.39)→ `Police (Ukraine):2014-01-21` [Dashed arrow to `Security Service of Ukraine` with weight **0.74 ✓**]
* **Path 1.2:** `Party of Regions` →(obstruct Passage⁻¹, 0.23)→ `Protester (Ukraine):2014-02-18`
* →(repression⁻¹, 0.31)→ `Police (Ukraine):2014-01-12` →(make Statement, 0.05)→ `Security Service of Ukraine:2014-04-18` [Dashed arrow to `Security Service of Ukraine` with weight **0.13 ✗**]
**2. Bottom Branch (Diplomatic Consultations):**
* **Path 2.1:** `Party of Regions` →(consult, 0.19)→ `Arseniy Yatsenyuk:2014-03-27`
* →(consult⁻¹, 0.12)→ `John Kerry:2014-02-01` →(discussBy Telephone⁻¹, 0.10)→ `Benjamin Netanyahu:2014-03-19` [Dashed arrow to `Benjamin Netanyahu` with weight **0.08 ✗**]
**3. Additional Node (Top Center):**
* An isolated node `Police (Ukraine):2014-01-21` appears at the top center with no incoming or outgoing edges shown in this view.
### Key Observations
* **Temporal Clustering:** All dated nodes fall within a four-month window from January 12, 2014, to April 18, 2014, aligning with the peak of the Euromaidan protests and the subsequent political transition in Ukraine.
* **Relationship Weights:** Weights vary significantly, from a high of **0.74** (for a link to the Security Service of Ukraine) to lows of **0.05** and **0.08**. The highest-weighted path (0.74) is marked with a checkmark (✓), suggesting it is a verified or high-confidence relationship. The lower-weighted terminal paths (0.13, 0.08) are marked with crosses (✗), suggesting they are incorrect, low-confidence, or disproven links.
* **Entity Focus:** The graph heavily features the **Police (Ukraine)** and the **Security Service of Ukraine** as central actors in the "repression" and "appeal" pathways. Diplomatic figures (Yatsenyuk, Kerry, Netanyahu) form a separate, lower-confidence cluster.
* **Inverse Relationships:** The frequent use of the "⁻¹" superscript (e.g., `reduceRelations⁻¹`, `consult⁻¹`) indicates the model explicitly accounts for the inverse direction of a base relationship.
### Interpretation
This diagram appears to be a visual output from a computational model (likely a knowledge graph completion or link prediction model) analyzing events from the 2014 Ukrainian crisis. It attempts to map and quantify the relationships between political parties, state security apparatus, protesters, and international figures.
* **What it Suggests:** The model posits that the Party of Regions' actions (reducing relations, obstructing passage, consulting) triggered a cascade of interactions, primarily involving state security forces engaging in repression and making appeals/statements. A separate, weaker diplomatic channel involving Yatsenyuk, Kerry, and Netanyahu is also modeled.
* **Element Relationships:** The graph structure implies causality or influence flow. The numerical weights likely represent the model's confidence in the existence or strength of that specific relationship given the available data. The checkmarks and crosses serve as a validation layer, possibly comparing model predictions to ground-truth data.
* **Notable Anomalies:** The inclusion of **Benjamin Netanyahu** is a notable outlier, as his direct involvement in the Ukrainian domestic crisis of early 2014 is not a widely documented central event. This link, with its very low weight (0.08) and cross mark, may represent a noisy or incorrect inference by the model. The duplicate `Police (Ukraine):2014-01-21` nodes could indicate the model treats different interaction contexts as separate instances, or it may be a visualization artifact.
**In essence, the image provides a structured, probabilistic interpretation of the complex web of interactions during a critical historical period, highlighting both high-confidence pathways of state response and more speculative or tenuous connections.**