## Bar Charts and Diagram: Model Performance and Architecture
### Overview
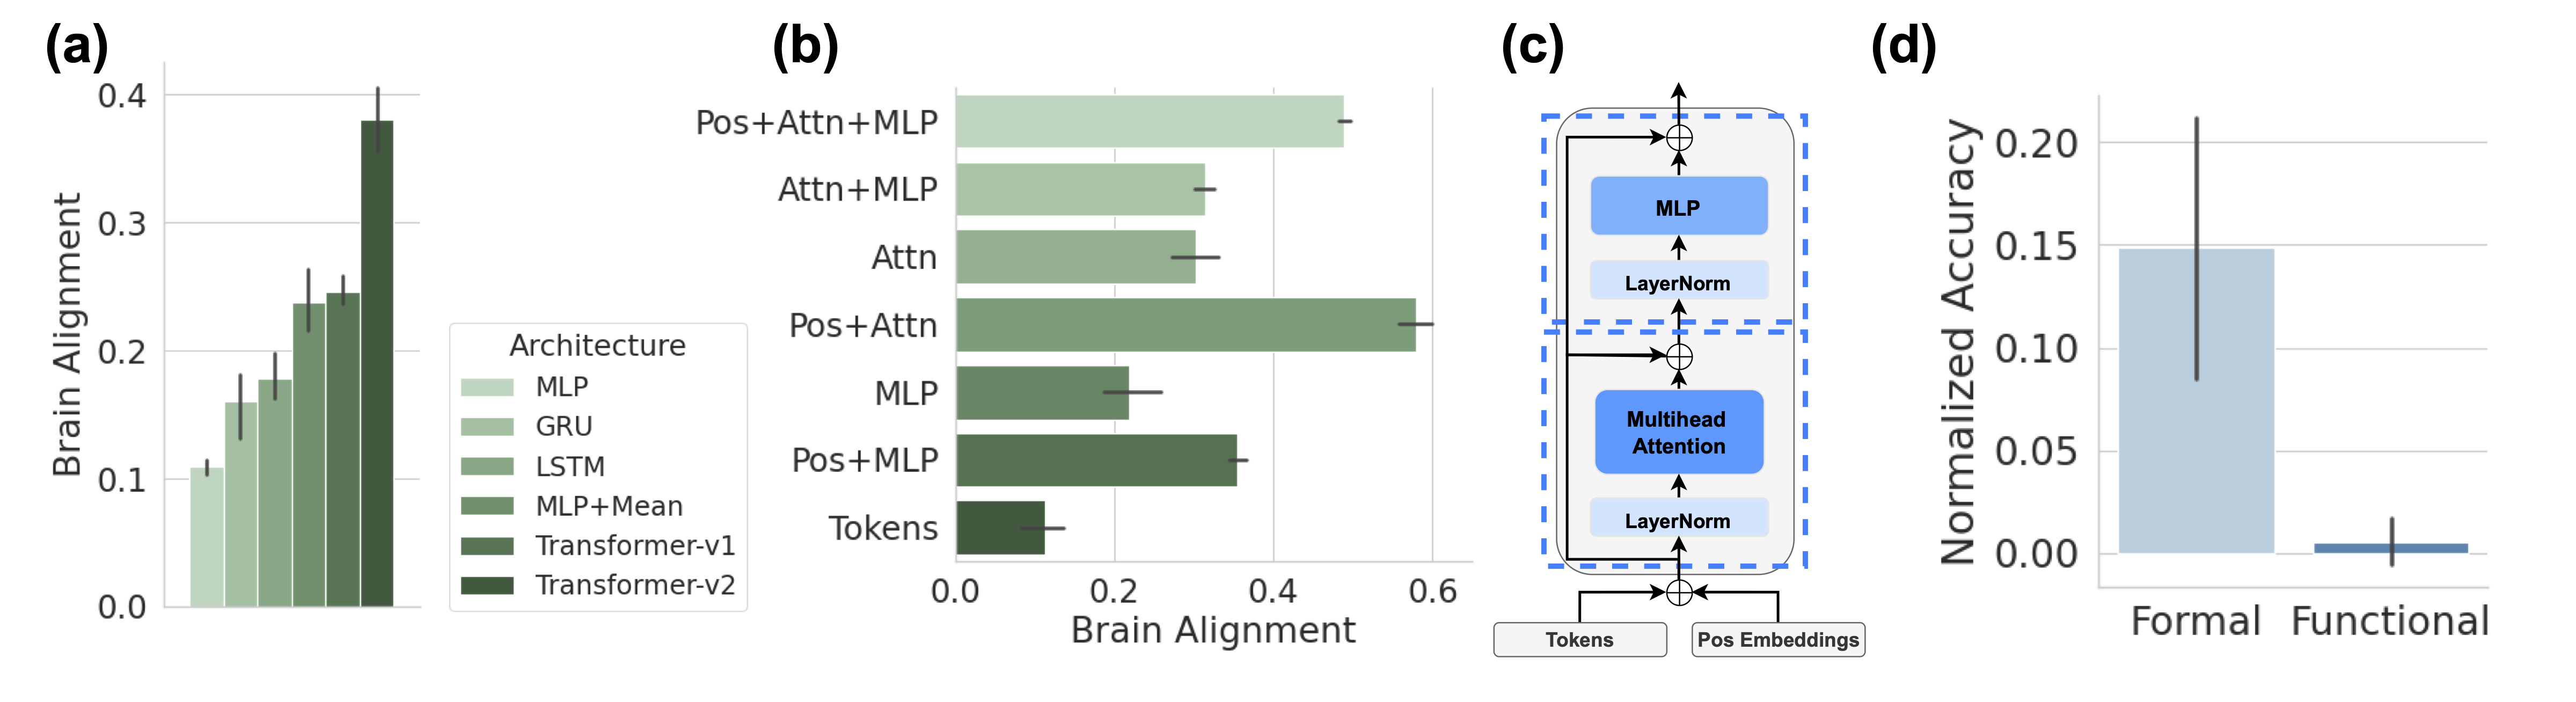
The image presents four sub-figures (a, b, c, d) illustrating the performance and architecture of different models. Sub-figures (a) and (b) are bar charts showing "Brain Alignment" scores for various model architectures. Sub-figure (c) is a diagram depicting a model architecture. Sub-figure (d) is a bar chart comparing "Normalized Accuracy" for "Formal" and "Functional" categories.
### Components/Axes
#### Sub-figure (a): Vertical Bar Chart
* **Title:** (a)
* **X-axis:** Implicit categories represented by the bars, corresponding to the "Architecture" legend.
* **Y-axis:** "Brain Alignment", with a scale from 0.0 to 0.4.
* Y-axis markers: 0.0, 0.1, 0.2, 0.3, 0.4
* **Legend (positioned to the right of the chart):** "Architecture"
* MLP (lightest green)
* GRU (mid-light green)
* LSTM (mid-green)
* MLP+Mean (mid-dark green)
* Transformer-v1 (dark green)
* Transformer-v2 (darkest green)
#### Sub-figure (b): Horizontal Bar Chart
* **Title:** (b)
* **X-axis:** "Brain Alignment", with a scale from 0.0 to 0.6.
* X-axis markers: 0.0, 0.2, 0.4, 0.6
* **Y-axis:** Model architectures:
* Pos+Attn+MLP (lightest green)
* Attn+MLP (mid-light green)
* Attn (mid-green)
* Pos+Attn (mid-dark green)
* MLP (dark green)
* Pos+MLP (darkest green)
* Tokens (darkest green)
* **Legend:** The same "Architecture" legend as in sub-figure (a) applies implicitly, with the bar colors corresponding to the architectures listed on the Y-axis.
#### Sub-figure (c): Diagram
* **Title:** (c)
* **Components:**
* Input: "Tokens", "Pos Embeddings"
* Processing Blocks (within a dashed blue box):
* "Multihead Attention" (blue box)
* "LayerNorm" (light blue box)
* "MLP" (blue box)
* "LayerNorm" (light blue box)
* Summation symbols (⊕) indicating addition/merging of data streams.
* Arrows indicating the flow of data.
#### Sub-figure (d): Vertical Bar Chart
* **Title:** (d)
* **X-axis:** Categories: "Formal", "Functional"
* **Y-axis:** "Normalized Accuracy", with a scale from 0.00 to 0.20.
* Y-axis markers: 0.00, 0.05, 0.10, 0.15, 0.20
* **Bars:**
* "Formal" (light blue)
* "Functional" (dark blue)
### Detailed Analysis
#### Sub-figure (a): Vertical Bar Chart
The "Brain Alignment" increases as the model architecture changes from MLP to Transformer-v2.
* MLP: ~0.10
* GRU: ~0.14
* LSTM: ~0.17
* MLP+Mean: ~0.20
* Transformer-v1: ~0.24
* Transformer-v2: ~0.38
#### Sub-figure (b): Horizontal Bar Chart
The "Brain Alignment" varies across different architectures.
* Pos+Attn+MLP: ~0.55
* Attn+MLP: ~0.35
* Attn: ~0.30
* Pos+Attn: ~0.50
* MLP: ~0.20
* Pos+MLP: ~0.25
* Tokens: ~0.10
#### Sub-figure (c): Diagram
The diagram shows a model architecture that processes "Tokens" and "Pos Embeddings". The data flows through a "LayerNorm" layer, then a "Multihead Attention" block, another "LayerNorm" layer, and finally an "MLP" layer. Summation symbols indicate that the input is added to the output of the "MLP" block.
#### Sub-figure (d): Vertical Bar Chart
The "Normalized Accuracy" is significantly higher for "Formal" compared to "Functional".
* Formal: ~0.15
* Functional: ~0.01
### Key Observations
* **Sub-figure (a):** Transformer-v2 achieves the highest "Brain Alignment" score among the listed architectures.
* **Sub-figure (b):** "Pos+Attn+MLP" and "Pos+Attn" architectures have the highest "Brain Alignment" scores.
* **Sub-figure (c):** The model architecture includes "Multihead Attention" and "MLP" blocks, with "LayerNorm" applied before each.
* **Sub-figure (d):** "Formal" category has a much higher "Normalized Accuracy" than "Functional".
### Interpretation
The data suggests that more complex model architectures, particularly those incorporating "Attention" mechanisms (as seen in sub-figures a and b), tend to achieve higher "Brain Alignment" scores. The diagram in sub-figure (c) illustrates a specific architecture that combines "Multihead Attention" and "MLP" layers, which are likely contributing to the improved performance. The significant difference in "Normalized Accuracy" between "Formal" and "Functional" categories (sub-figure d) indicates that the model performs better on "Formal" tasks compared to "Functional" tasks. The "Brain Alignment" metric may be related to how well the model's internal representations align with brain activity patterns, suggesting that Transformer-based models are better at capturing relevant information.