## Bar Charts & Diagram: Neural Network Alignment & Accuracy
### Overview
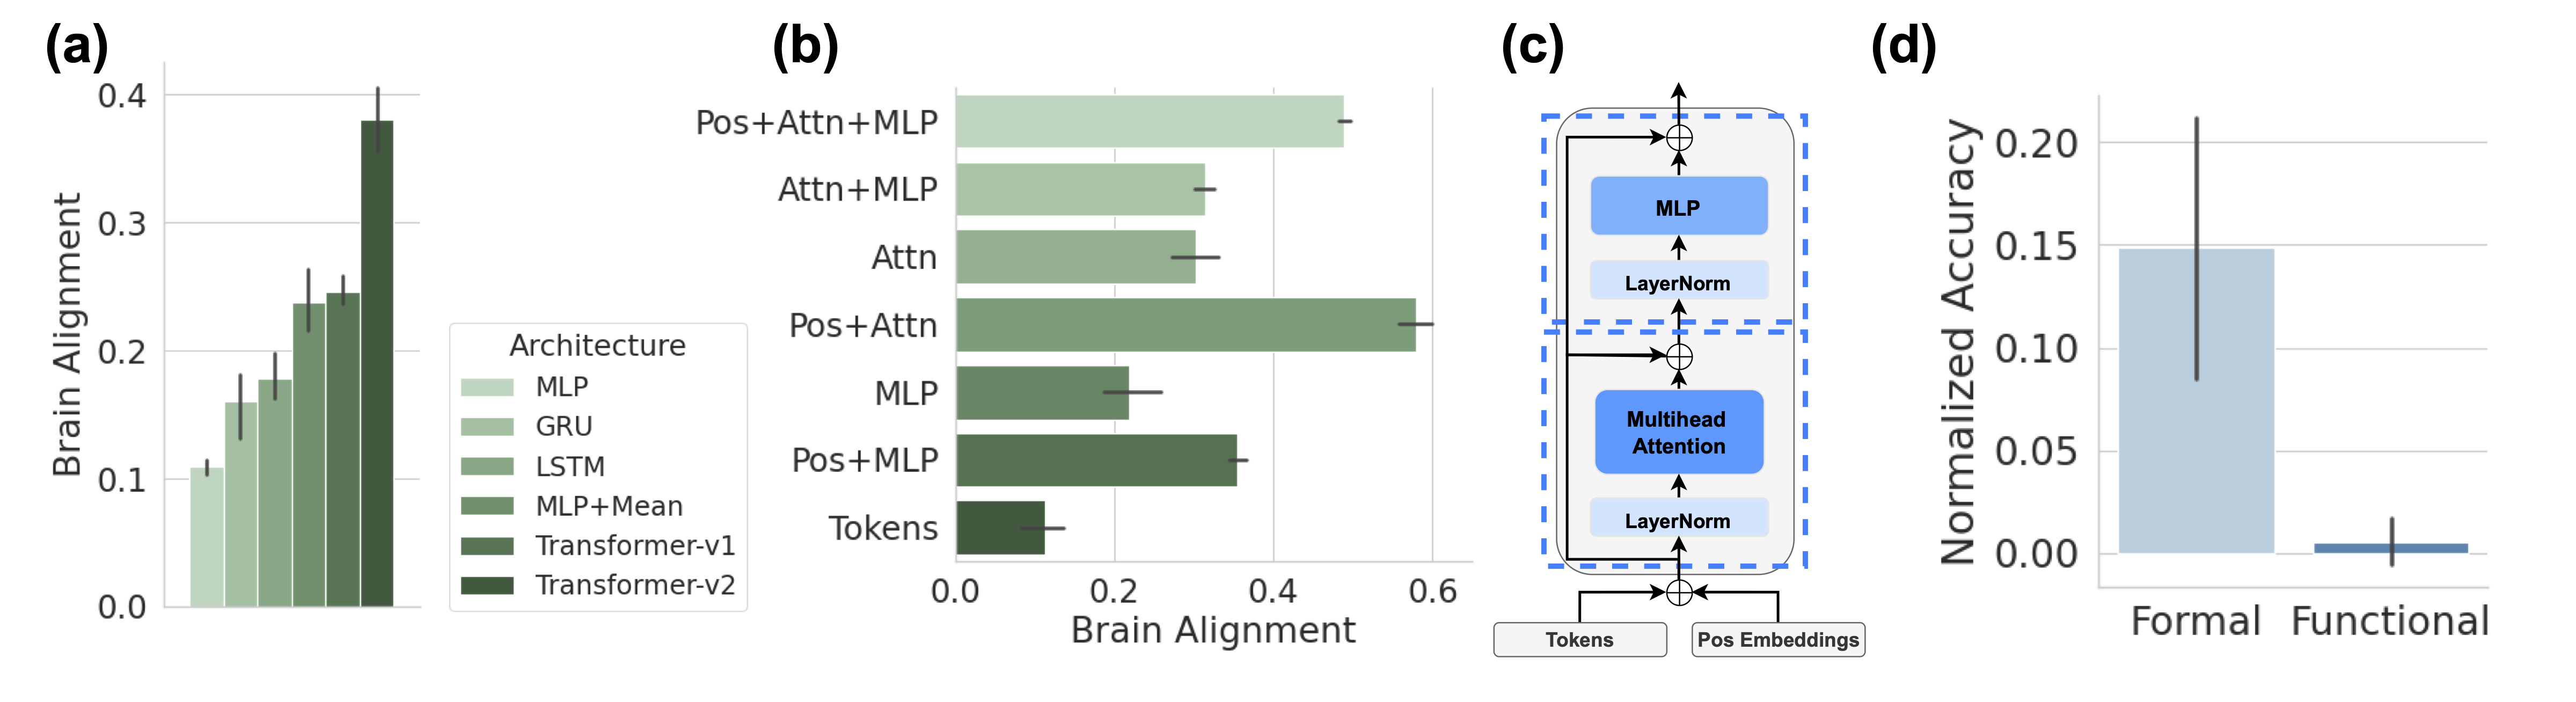
The image presents a series of four sub-figures (a, b, c, and d) illustrating the brain alignment scores of different neural network architectures and a diagram of a Transformer architecture, alongside a comparison of normalized accuracy between "Formal" and "Functional" approaches. Sub-figures (a) and (b) are bar charts with error bars, (c) is a diagram of a Transformer block, and (d) is a bar chart.
### Components/Axes
* **(a) Brain Alignment vs. Architecture:**
* X-axis: Architecture (MLP, GRU, LSTM, MLP+Mean, Transformer-v1, Transformer-v2)
* Y-axis: Brain Alignment (ranging from 0.0 to 0.4)
* **(b) Brain Alignment vs. Architecture:**
* X-axis: Architecture (MLP, Pos+MLP)
* Y-axis: Brain Alignment (ranging from 0.0 to 0.6)
* **(c) Transformer Block Diagram:**
* Components: Tokens, Pos Embeddings, Multihead Attention, LayerNorm, MLP. Arrows indicate data flow.
* **(d) Normalized Accuracy vs. Approach:**
* X-axis: Approach (Formal, Functional)
* Y-axis: Normalized Accuracy (ranging from 0.0 to 0.2)
* **Legend (a):**
* MLP: Light Green
* GRU: Medium Green
* LSTM: Dark Green
* MLP+Mean: Brown
* Transformer-v1: Dark Gray
* Transformer-v2: Black
* **Legend (b):**
* MLP: Light Green
* Pos+MLP: Dark Green
### Detailed Analysis or Content Details
**(a) Brain Alignment vs. Architecture:**
* **MLP:** Approximately 0.25 ± 0.05. The error bar extends from roughly 0.15 to 0.35.
* **GRU:** Approximately 0.18 ± 0.08. The error bar extends from roughly 0.10 to 0.26.
* **LSTM:** Approximately 0.22 ± 0.06. The error bar extends from roughly 0.16 to 0.28.
* **MLP+Mean:** Approximately 0.32 ± 0.07. The error bar extends from roughly 0.25 to 0.39.
* **Transformer-v1:** Approximately 0.35 ± 0.06. The error bar extends from roughly 0.29 to 0.41.
* **Transformer-v2:** Approximately 0.38 ± 0.04. The error bar extends from roughly 0.34 to 0.42.
**(b) Brain Alignment vs. Architecture:**
* **MLP:** Approximately 0.45 ± 0.05. The error bar extends from roughly 0.40 to 0.50.
* **Pos+MLP:** Approximately 0.52 ± 0.04. The error bar extends from roughly 0.48 to 0.56.
**(c) Transformer Block Diagram:**
* Tokens and Pos Embeddings are fed into a Multihead Attention layer.
* The output of Multihead Attention is passed through a LayerNorm.
* The output of LayerNorm is passed through an MLP (Multi-Layer Perceptron).
* The output of MLP is passed through another LayerNorm.
* Arrows indicate the flow of data from Tokens/Pos Embeddings -> Multihead Attention -> LayerNorm -> MLP -> LayerNorm.
**(d) Normalized Accuracy vs. Approach:**
* **Formal:** Approximately 0.16 ± 0.03. The error bar extends from roughly 0.13 to 0.19.
* **Functional:** Approximately 0.01 ± 0.01. The error bar extends from roughly 0.00 to 0.02.
### Key Observations
* Transformer-v2 consistently shows the highest brain alignment score in (a).
* Pos+MLP shows a higher brain alignment score than MLP in (b).
* The "Formal" approach exhibits significantly higher normalized accuracy than the "Functional" approach in (d).
* The error bars in (a) and (d) indicate some variability in the data.
### Interpretation
The data suggests that more complex architectures, specifically Transformer-v2, demonstrate a stronger alignment with brain activity as measured by the "Brain Alignment" metric. The addition of positional embeddings (Pos+MLP) also improves brain alignment compared to a standard MLP. The Transformer diagram (c) illustrates the core components of this architecture, highlighting the role of attention mechanisms and normalization layers.
The stark difference in normalized accuracy between the "Formal" and "Functional" approaches (d) indicates that the "Formal" approach is substantially more effective in this context. This could be due to the "Formal" approach being better suited to capture the underlying structure of the data or the task at hand.
The error bars suggest that there is some degree of uncertainty in the measurements, and further investigation may be needed to confirm these findings. The use of error bars is a good practice, as it acknowledges the inherent variability in experimental data. The combination of brain alignment scores and accuracy metrics provides a comprehensive evaluation of the different neural network architectures and approaches.