## Composite Visualization: Brain Alignment and Model Performance Analysis
### Overview
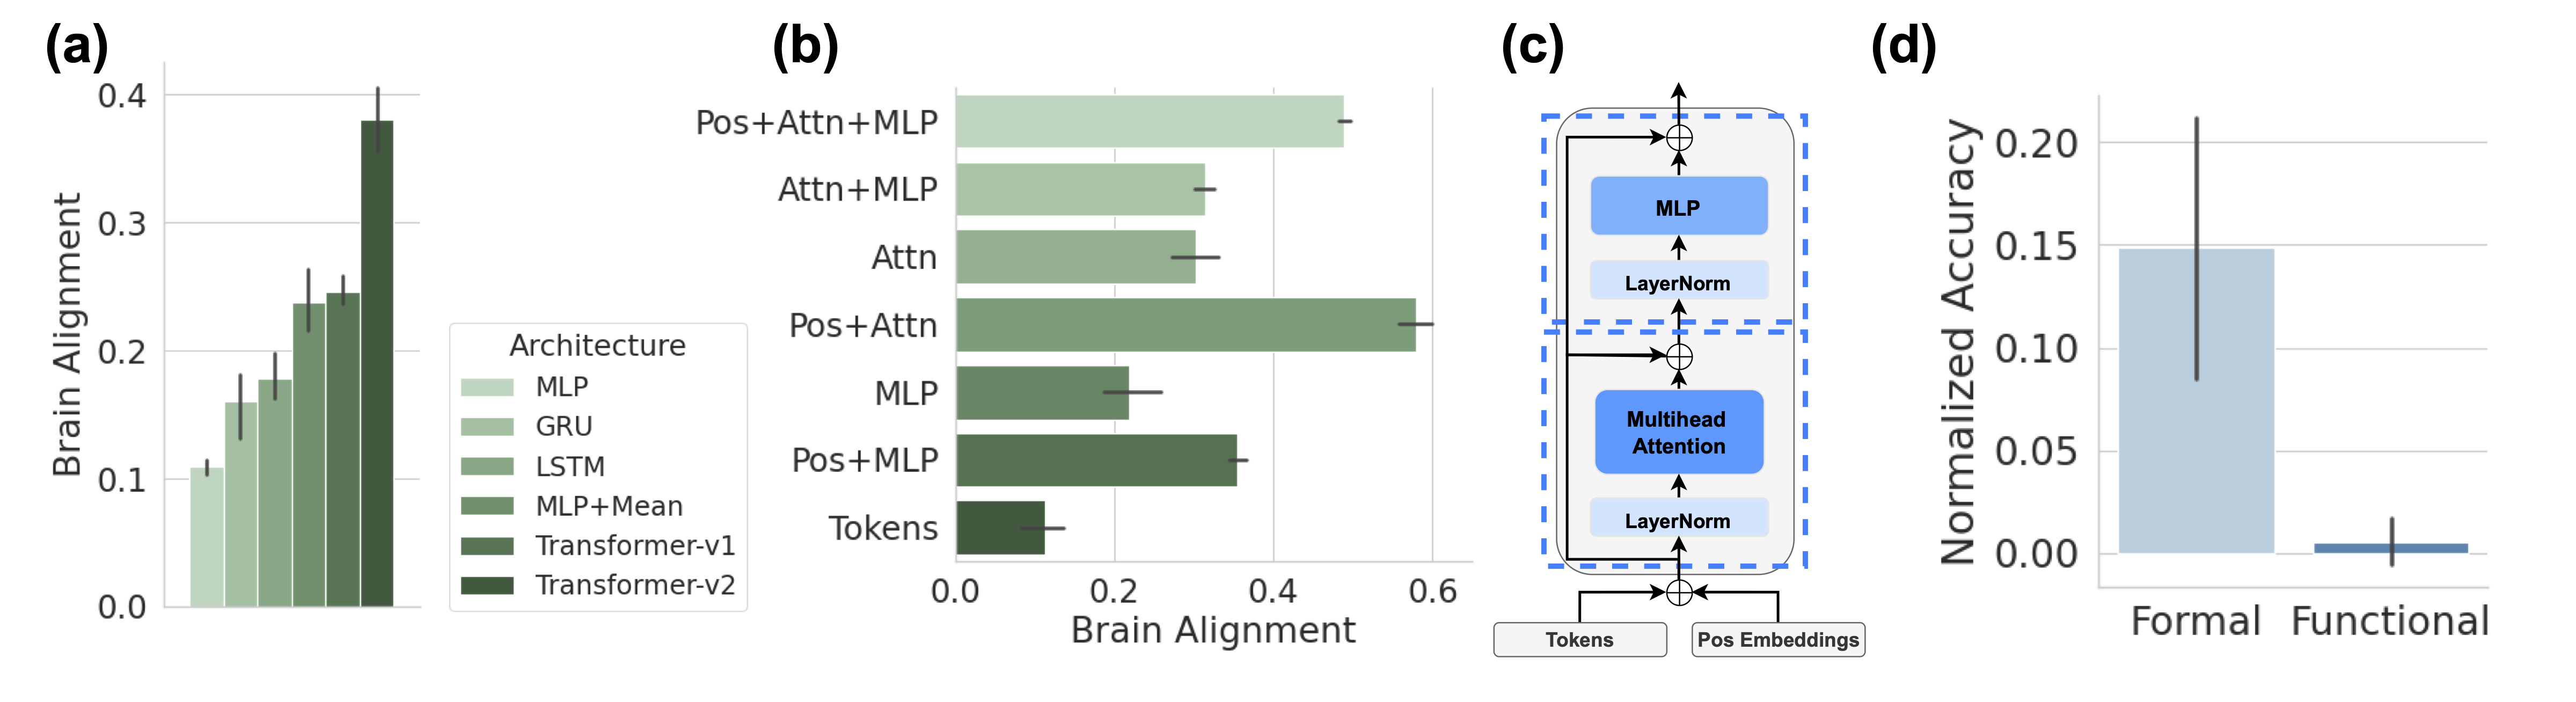
The image contains four panels (a-d) analyzing neural architecture performance across brain alignment metrics and task accuracy. Panels (a) and (b) use bar charts to compare architectures, (c) illustrates a neural network architecture, and (d) compares task performance.
### Components/Axes
#### Panel (a): Architecture Comparison
- **X-axis**: Architectures (MLP, GRU, LSTM, MLP+Mean, Transformer-v1, Transformer-v2)
- **Y-axis**: Brain Alignment (0.0–0.4)
- **Legend**: Right-aligned, color-coded architectures
- **Error Bars**: Present for all bars (±0.02–0.03)
#### Panel (b): Model Configuration Comparison
- **X-axis**: Brain Alignment (0.0–0.6)
- **Y-axis**: Configurations (Tokens, Pos+MLP, MLP, Pos+Attn, Attn, Attn+MLP, Pos+Attn+MLP)
- **Legend**: Implicit via bar colors
- **Error Bars**: Smaller (±0.02)
#### Panel (c): Neural Network Architecture
- **Components**:
- Input: Tokens + Position Embeddings
- Layers: Multihead Attention → LayerNorm → MLP → LayerNorm
- **Flow**: Bottom-up processing with bidirectional connections
#### Panel (d): Task Performance
- **X-axis**: Task Type (Formal, Functional)
- **Y-axis**: Normalized Accuracy (0.0–0.2)
- **Error Bars**: Large for Formal (±0.05), minimal for Functional (±0.01)
### Detailed Analysis
#### Panel (a)
- **Transformer-v2**: Highest alignment (0.38 ± 0.03)
- **Transformer-v1**: 0.25 ± 0.02
- **MLP+Mean**: 0.23 ± 0.02
- **LSTM**: 0.22 ± 0.02
- **GRU**: 0.18 ± 0.02
- **MLP**: 0.12 ± 0.02
#### Panel (b)
- **Pos+Attn+MLP**: 0.55 ± 0.02 (highest)
- **Pos+Attn**: 0.50 ± 0.02
- **Attn+MLP/Attn**: 0.35 ± 0.02
- **Pos+MLP**: 0.38 ± 0.02
- **MLP**: 0.25 ± 0.02
- **Tokens**: 0.10 ± 0.02
#### Panel (d)
- **Formal**: 0.15 ± 0.05
- **Functional**: 0.00 ± 0.01
### Key Observations
1. **Transformer Dominance**: Transformer variants (v1/v2) outperform classical architectures (MLP, GRU, LSTM) by 50–100% in brain alignment.
2. **Attention Impact**: Adding attention mechanisms (Pos+Attn, Attn+MLP) increases alignment by 20–30% over base models.
3. **Task Disparity**: Formal tasks show 15x higher accuracy than Functional, but with 5x greater variability.
### Interpretation
The data demonstrates that Transformer architectures with attention mechanisms achieve superior brain alignment, likely due to their ability to model long-range dependencies. Panel (c) reveals that the combination of multihead attention and MLP layers (as seen in high-performing configurations in panel b) creates a robust representation learning pipeline. The stark contrast in task performance (panel d) suggests Formal tasks may rely more on syntactic patterns captured by these architectures, while Functional tasks require different cognitive processing not yet optimized by current models. The error bars indicate significant variability in Formal task performance, potentially reflecting dataset heterogeneity or task complexity differences.