## Bar Charts: Llama-3.2 Model Performance (ΔAP) by Dataset and Anchoring Method
### Overview
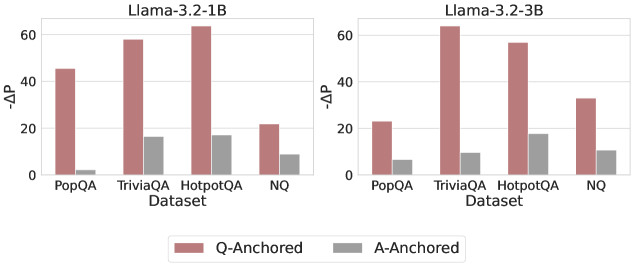
The image displays two side-by-side vertical bar charts comparing the performance change (ΔAP) of two different-sized language models (Llama-3.2-1B and Llama-3.2-3B) across four question-answering datasets. Performance is measured for two different methods: "Q-Anchored" and "A-Anchored".
### Components/Axes
* **Titles:**
* Left Chart: `Llama-3.2-1B`
* Right Chart: `Llama-3.2-3B`
* **Y-Axis (Both Charts):** Labeled `ΔAP`. The scale runs from 0 to 60, with major tick marks at 0, 20, 40, and 60.
* **X-Axis (Both Charts):** Labeled `Dataset`. The categories are, from left to right: `PopQA`, `TriviaQA`, `HotpotQA`, `NQ`.
* **Legend:** Positioned at the bottom center of the entire image, spanning both charts.
* A red/brown square corresponds to `Q-Anchored`.
* A gray square corresponds to `A-Anchored`.
### Detailed Analysis
**Chart 1: Llama-3.2-1B (Left)**
* **Trend Verification:** For all four datasets, the red `Q-Anchored` bar is significantly taller than the gray `A-Anchored` bar.
* **Data Points (Approximate ΔAP values):**
* **PopQA:** Q-Anchored ≈ 45, A-Anchored ≈ 3
* **TriviaQA:** Q-Anchored ≈ 58, A-Anchored ≈ 18
* **HotpotQA:** Q-Anchored ≈ 65 (exceeds the 60 axis line), A-Anchored ≈ 18
* **NQ:** Q-Anchored ≈ 22, A-Anchored ≈ 10
**Chart 2: Llama-3.2-3B (Right)**
* **Trend Verification:** Similar to the 1B model, the `Q-Anchored` bars are consistently taller than the `A-Anchored` bars across all datasets.
* **Data Points (Approximate ΔAP values):**
* **PopQA:** Q-Anchored ≈ 25, A-Anchored ≈ 8
* **TriviaQA:** Q-Anchored ≈ 65 (exceeds the 60 axis line), A-Anchored ≈ 10
* **HotpotQA:** Q-Anchored ≈ 58, A-Anchored ≈ 18
* **NQ:** Q-Anchored ≈ 35, A-Anchored ≈ 12
### Key Observations
1. **Dominant Method:** The `Q-Anchored` method yields a substantially higher ΔAP than the `A-Anchored` method for every dataset-model combination shown.
2. **Model Size Impact:** The larger `Llama-3.2-3B` model achieves higher peak ΔAP values (notably on TriviaQA and HotpotQA) compared to the `Llama-3.2-1B` model.
3. **Dataset Sensitivity:** The performance gain (ΔAP) varies significantly by dataset. For the 1B model, HotpotQA shows the highest Q-Anchored gain. For the 3B model, TriviaQA shows the highest gain.
4. **A-Anchored Stability:** The performance of the `A-Anchored` method is relatively low and stable across datasets, generally ranging between ΔAP values of 3 to 18, with less variation than the Q-Anchored method.
### Interpretation
The data suggests that for the evaluated Llama-3.2 models, anchoring on the question (`Q-Anchored`) is a far more effective strategy for improving performance (as measured by ΔAP) than anchoring on the answer (`A-Anchored`). This advantage holds across diverse QA datasets (PopQA, TriviaQA, HotpotQA, NQ).
The relationship between model size and performance gain is non-uniform. While the 3B model shows a higher maximum gain, the 1B model's largest gain is on HotpotQA, whereas the 3B model's largest gain shifts to TriviaQA. This indicates that the optimal dataset for observing performance improvements may depend on the model's scale.
The consistently low ΔAP for the `A-Anchored` method implies that simply conditioning on the answer provides minimal benefit over the baseline, or may even be a less effective prompting/anchoring technique for these tasks. The notable outlier is the Q-Anchored performance on HotpotQA for the 1B model, which is exceptionally high relative to its performance on other datasets, suggesting a particular synergy between that model size, the Q-Anchored method, and the nature of the HotpotQA dataset (which often requires multi-hop reasoning).