## Bar Chart: Performance Comparison of Llama-3.2-1B and Llama-3.2-3B Models
### Overview
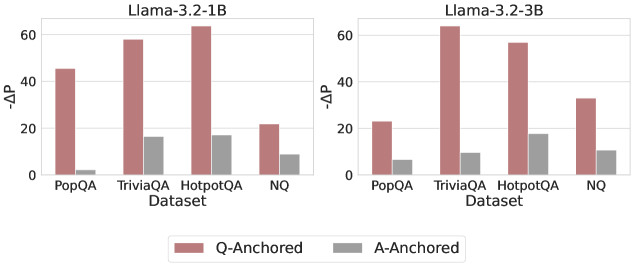
The image contains two side-by-side bar charts comparing the performance of two language models (Llama-3.2-1B and Llama-3.2-3B) across four question-answering datasets (PopQA, TriviaQA, HotpotQA, NQ). Performance is measured using the metric "-ΔP" (negative delta P), with separate bars for "Q-Anchored" (red) and "A-Anchored" (gray) approaches. The charts highlight differences in performance between model sizes and anchoring strategies.
### Components/Axes
- **X-Axis (Datasets)**: PopQA, TriviaQA, HotpotQA, NQ (categorical, left to right).
- **Y-Axis (-ΔP)**: Numerical scale from 0 to 60, with increments of 20.
- **Legend**: Located at the bottom center, with red representing "Q-Anchored" and gray representing "A-Anchored".
- **Model Labels**:
- Left chart: "Llama-3.2-1B" (top-left).
- Right chart: "Llama-3.2-3B" (top-right).
### Detailed Analysis
#### Llama-3.2-1B (Left Chart)
- **PopQA**:
- Q-Anchored: ~45
- A-Anchored: ~2
- **TriviaQA**:
- Q-Anchored: ~58
- A-Anchored: ~16
- **HotpotQA**:
- Q-Anchored: ~62
- A-Anchored: ~16
- **NQ**:
- Q-Anchored: ~22
- A-Anchored: ~8
#### Llama-3.2-3B (Right Chart)
- **PopQA**:
- Q-Anchored: ~23
- A-Anchored: ~5
- **TriviaQA**:
- Q-Anchored: ~63
- A-Anchored: ~9
- **HotpotQA**:
- Q-Anchored: ~57
- A-Anchored: ~18
- **NQ**:
- Q-Anchored: ~32
- A-Anchored: ~10
### Key Observations
1. **Q-Anchored Dominance**:
- Q-Anchored consistently outperforms A-Anchored across all datasets and models.
- Llama-3.2-1B achieves the highest Q-Anchored performance on HotpotQA (~62), while Llama-3.2-3B excels on TriviaQA (~63).
2. **Model Size Impact**:
- Llama-3.2-3B generally outperforms Llama-3.2-1B in Q-Anchored for TriviaQA and NQ but underperforms on PopQA and HotpotQA.
- A-Anchored performance improves slightly with larger models (e.g., HotpotQA: 16 → 18).
3. **NQ Dataset Anomaly**:
- Llama-3.2-3B’s Q-Anchored performance (~32) is lower than Llama-3.2-1B’s (~22), contradicting the trend of larger models performing better.
4. **A-Anchored Variability**:
- A-Anchored values are consistently low but show modest gains with larger models (e.g., TriviaQA: 16 → 9, HotpotQA: 16 → 18).
### Interpretation
The data suggests that **Q-Anchored methods are significantly more effective** than A-Anchored approaches for both models, with performance heavily dependent on the dataset. While Llama-3.2-3B generally improves Q-Anchored results, its underperformance on NQ raises questions about scalability or dataset-specific limitations. The modest gains in A-Anchored performance with larger models indicate potential for optimization but highlight a persistent gap compared to Q-Anchored. The NQ dataset’s anomalous results for Llama-3.2-3B warrant further investigation into model behavior on this specific task.