## Bar Chart: Accuracy vs. Difficulty Level for Different Models
### Overview
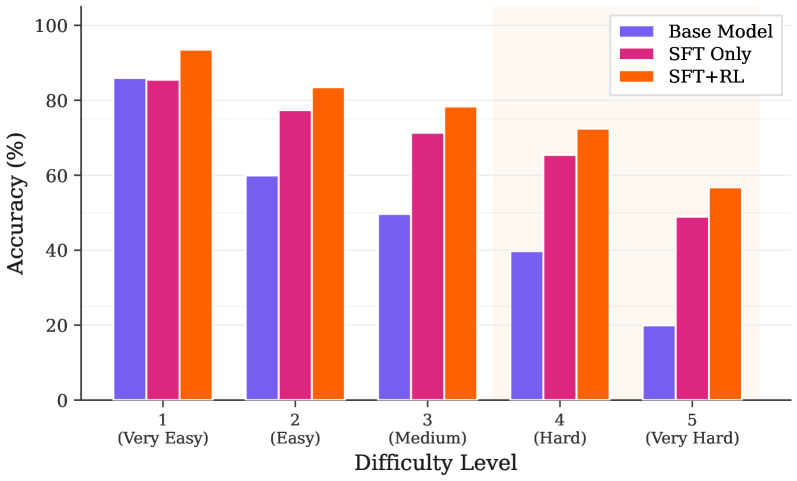
The image is a bar chart comparing the accuracy of three different models (Base Model, SFT Only, and SFT+RL) across five difficulty levels (Very Easy, Easy, Medium, Hard, and Very Hard). The y-axis represents accuracy in percentage, ranging from 0 to 100. The x-axis represents the difficulty level.
### Components/Axes
* **Y-axis:**
* Label: "Accuracy (%)"
* Scale: 0 to 100, with tick marks at intervals of 20 (0, 20, 40, 60, 80, 100).
* **X-axis:**
* Label: "Difficulty Level"
* Categories: 1 (Very Easy), 2 (Easy), 3 (Medium), 4 (Hard), 5 (Very Hard)
* **Legend (located at the top-right):**
* Base Model (Blue)
* SFT Only (Magenta)
* SFT+RL (Orange)
### Detailed Analysis
Here's a breakdown of the accuracy for each model at each difficulty level:
* **Difficulty Level 1 (Very Easy):**
* Base Model (Blue): Approximately 86%
* SFT Only (Magenta): Approximately 85%
* SFT+RL (Orange): Approximately 93%
* **Difficulty Level 2 (Easy):**
* Base Model (Blue): Approximately 60%
* SFT Only (Magenta): Approximately 77%
* SFT+RL (Orange): Approximately 83%
* **Difficulty Level 3 (Medium):**
* Base Model (Blue): Approximately 50%
* SFT Only (Magenta): Approximately 71%
* SFT+RL (Orange): Approximately 78%
* **Difficulty Level 4 (Hard):**
* Base Model (Blue): Approximately 40%
* SFT Only (Magenta): Approximately 65%
* SFT+RL (Orange): Approximately 72%
* **Difficulty Level 5 (Very Hard):**
* Base Model (Blue): Approximately 20%
* SFT Only (Magenta): Approximately 49%
* SFT+RL (Orange): Approximately 57%
**Trends:**
* **Base Model (Blue):** Accuracy decreases significantly as difficulty level increases.
* **SFT Only (Magenta):** Accuracy also decreases as difficulty level increases, but generally performs better than the Base Model.
* **SFT+RL (Orange):** Accuracy decreases as difficulty level increases, and generally performs the best among the three models.
### Key Observations
* The SFT+RL model consistently outperforms the other two models across all difficulty levels.
* The Base Model shows the most significant drop in accuracy as difficulty increases.
* The difference in accuracy between the models is more pronounced at higher difficulty levels.
### Interpretation
The data suggests that both SFT Only and SFT+RL models improve upon the Base Model, with SFT+RL providing the most significant improvement in accuracy, especially as the difficulty of the task increases. This indicates that the SFT+RL model is more robust and better equipped to handle complex tasks compared to the other two models. The steep decline in accuracy for the Base Model as difficulty increases highlights the limitations of the base model in handling more challenging tasks.