\n
## Grouped Bar Chart: Model Accuracy by Difficulty Level
### Overview
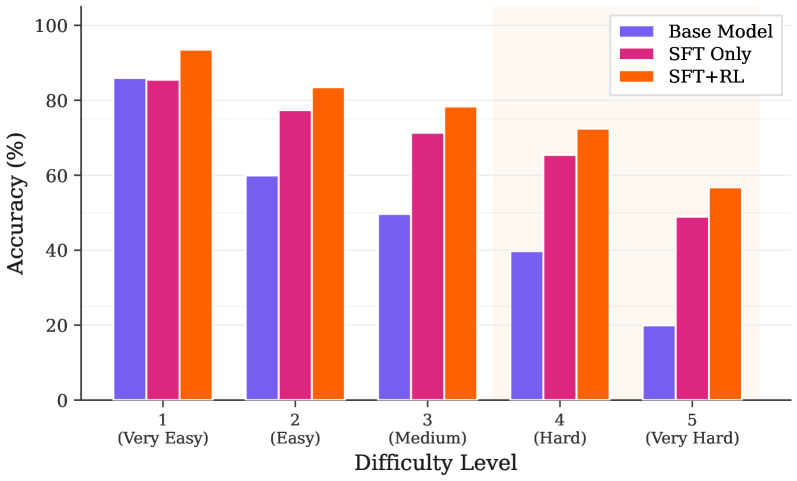
The image displays a grouped bar chart comparing the accuracy percentages of three different models across five difficulty levels. The chart visually demonstrates how model performance degrades as task difficulty increases, with one model consistently outperforming the others.
### Components/Axes
* **Chart Type:** Grouped Bar Chart.
* **X-Axis (Horizontal):** Labeled "Difficulty Level". It contains five categorical groups:
1. `1 (Very Easy)`
2. `2 (Easy)`
3. `3 (Medium)`
4. `4 (Hard)`
5. `5 (Very Hard)`
* **Y-Axis (Vertical):** Labeled "Accuracy (%)". The scale runs from 0 to 100 in increments of 20 (0, 20, 40, 60, 80, 100).
* **Legend:** Located in the top-right corner of the chart area. It defines three data series:
* **Base Model:** Represented by purple bars.
* **SFT Only:** Represented by pink/magenta bars.
* **SFT+RL:** Represented by orange bars.
### Detailed Analysis
The following table reconstructs the approximate accuracy values for each model at each difficulty level. Values are estimated based on bar height relative to the y-axis grid lines.
| Difficulty Level | Base Model (Purple) | SFT Only (Pink) | SFT+RL (Orange) |
| :--- | :--- | :--- | :--- |
| **1 (Very Easy)** | ~85% | ~84% | ~93% |
| **2 (Easy)** | ~60% | ~77% | ~83% |
| **3 (Medium)** | ~49% | ~71% | ~78% |
| **4 (Hard)** | ~39% | ~65% | ~72% |
| **5 (Very Hard)** | ~20% | ~49% | ~56% |
**Trend Verification per Data Series:**
* **Base Model (Purple):** Shows a steep, consistent downward trend. Accuracy starts high (~85%) for very easy tasks but drops sharply with each increase in difficulty, reaching its lowest point (~20%) at the "Very Hard" level.
* **SFT Only (Pink):** Also shows a consistent downward trend, but the slope is less severe than the Base Model. It starts at a similar level to the Base Model (~84%) but maintains significantly higher accuracy at all subsequent difficulty levels.
* **SFT+RL (Orange):** Exhibits the most resilient performance. While it also follows a downward trend, it consistently achieves the highest accuracy at every single difficulty level. The performance gap between SFT+RL and the other models is most pronounced at the "Very Hard" level.
### Key Observations
1. **Performance Hierarchy:** A clear and consistent hierarchy is visible across all difficulty levels: `SFT+RL > SFT Only > Base Model`.
2. **Impact of Difficulty:** All models suffer a performance drop as difficulty increases. The drop is most catastrophic for the Base Model.
3. **Widening Gap:** The absolute performance gap between the models widens as difficulty increases. For example, at "Very Easy," the difference between the best (SFT+RL) and worst (Base Model) is ~8 percentage points. At "Very Hard," this gap expands to ~36 percentage points.
4. **SFT+RL Resilience:** The SFT+RL model demonstrates the greatest robustness, retaining over 50% accuracy even on "Very Hard" tasks, a level the Base Model fails to achieve beyond "Medium" difficulty.
### Interpretation
This chart provides strong evidence for the effectiveness of a training pipeline that combines Supervised Fine-Tuning (SFT) with Reinforcement Learning (RL).
* **What the data suggests:** The Base Model likely represents a foundational model with general capabilities. Applying SFT ("SFT Only") provides a significant and consistent boost in accuracy, indicating that task-specific supervised training is highly beneficial. The further addition of RL ("SFT+RL") yields another substantial improvement, suggesting that RL helps the model optimize its responses in a way that is particularly advantageous for more complex, higher-difficulty problems.
* **How elements relate:** The difficulty levels act as a stress test. The chart reveals that while SFT improves performance across the board, the combination of SFT and RL creates a model that is not only more accurate but also more **robust** to increasing task complexity. The widening gap implies that RL may be teaching the model more fundamental reasoning or problem-solving strategies that become critical when simple pattern matching (which might suffice for easy tasks) is no longer enough.
* **Notable Anomalies:** There are no major outliers or anomalous data points. The trends are smooth and consistent, which strengthens the conclusion that the observed performance differences are a direct result of the training methodologies (Base vs. SFT vs. SFT+RL) rather than noise or error. The data presents a clear narrative of incremental improvement through advanced training techniques.