## Bar Chart: Model Accuracy Across Difficulty Levels
### Overview
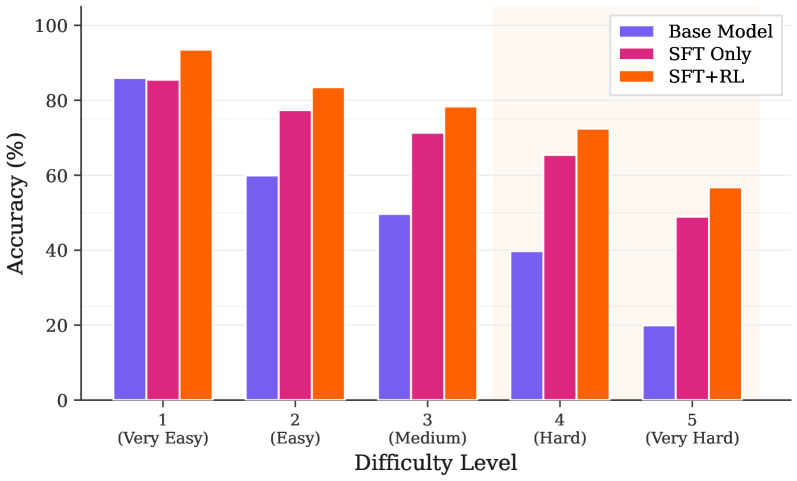
The chart compares the accuracy of three machine learning models (Base Model, SFT Only, SFT+RL) across five difficulty levels (Very Easy to Very Hard). Accuracy is measured in percentage, with higher values indicating better performance.
### Components/Axes
- **X-axis (Difficulty Level)**:
- Categories: Very Easy (1), Easy (2), Medium (3), Hard (4), Very Hard (5)
- **Y-axis (Accuracy %)**:
- Scale: 0% to 100% in 20% increments
- **Legend**:
- Top-right corner, color-coded:
- Purple: Base Model
- Pink: SFT Only
- Orange: SFT+RL
### Detailed Analysis
1. **Very Easy (1)**:
- Base Model: ~85%
- SFT Only: ~84%
- SFT+RL: ~93%
2. **Easy (2)**:
- Base Model: ~60%
- SFT Only: ~78%
- SFT+RL: ~83%
3. **Medium (3)**:
- Base Model: ~50%
- SFT Only: ~72%
- SFT+RL: ~78%
4. **Hard (4)**:
- Base Model: ~40%
- SFT Only: ~65%
- SFT+RL: ~72%
5. **Very Hard (5)**:
- Base Model: ~20%
- SFT Only: ~48%
- SFT+RL: ~57%
### Key Observations
- **SFT+RL consistently outperforms** all other models across all difficulty levels.
- **Base Model accuracy declines sharply** as difficulty increases, dropping from 85% (Very Easy) to 20% (Very Hard).
- **SFT Only** maintains higher accuracy than Base Model in all categories but lags behind SFT+RL.
- **Largest performance gap** occurs in "Very Hard" difficulty (SFT+RL: 57% vs. Base Model: 20%).
### Interpretation
The data demonstrates that **SFT+RL (Supervised Fine-Tuning + Reinforcement Learning)** is the most robust model, maintaining high accuracy even in extremely challenging scenarios. The Base Model's performance degradation in harder tasks suggests it lacks adaptability without additional training techniques. SFT Only shows moderate improvement over Base Model, indicating that supervised fine-tuning alone provides limited benefits compared to the combined SFT+RL approach. The widening accuracy gap in higher difficulty levels highlights the importance of reinforcement learning for handling complex, real-world tasks.