## Bar and Line Chart: Web Search Frequency and Hits@1 vs. IKG
### Overview
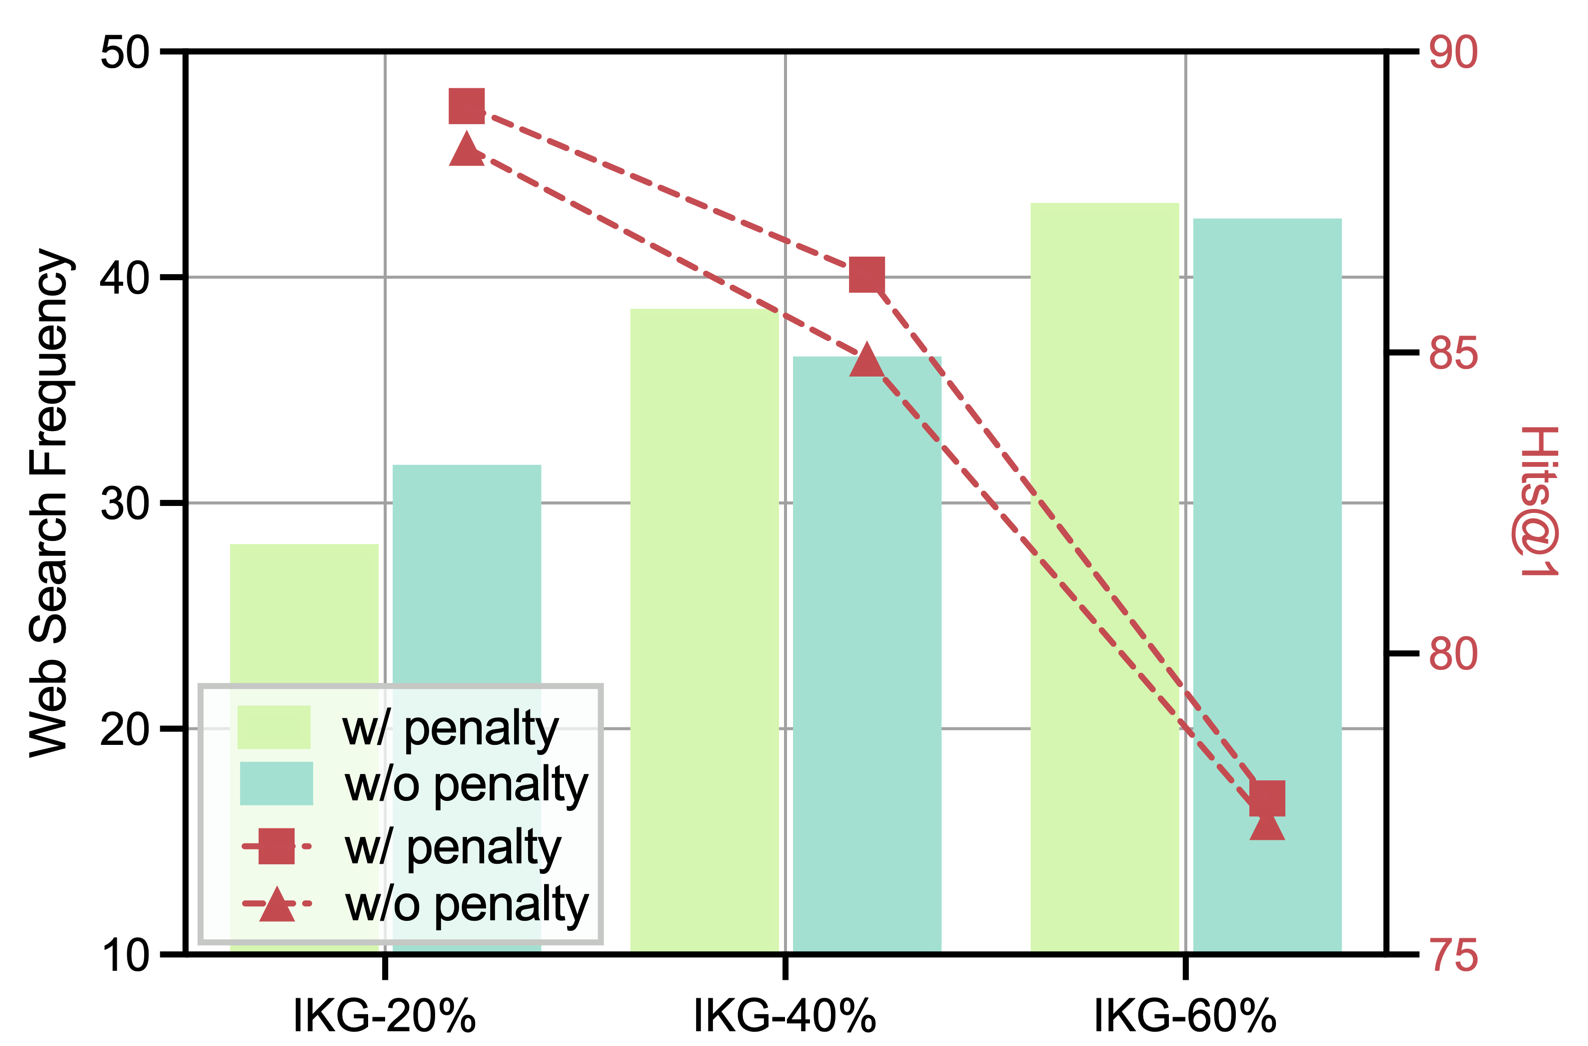
The image is a combination bar and line chart comparing "Web Search Frequency" (left y-axis) and "Hits@1" (right y-axis) across three categories: IKG-20%, IKG-40%, and IKG-60%. The chart displays data both with and without a penalty applied, using bars for "Web Search Frequency" and dashed lines with markers for "Hits@1".
### Components/Axes
* **X-axis:** Categorical axis labeled "IKG-20%", "IKG-40%", and "IKG-60%".
* **Left Y-axis:** Numerical axis labeled "Web Search Frequency", ranging from 10 to 50 in increments of 10.
* **Right Y-axis:** Numerical axis labeled "Hits@1", ranging from 75 to 90 in increments of 5.
* **Legend:** Located in the bottom-left corner, indicating:
* Light Green Bar: "w/ penalty" for Web Search Frequency
* Light Blue Bar: "w/o penalty" for Web Search Frequency
* Red Square Marker with Dashed Line: "w/ penalty" for Hits@1
* Red Triangle Marker with Dashed Line: "w/o penalty" for Hits@1
### Detailed Analysis
**Web Search Frequency (Bars):**
* **IKG-20%:**
* "w/ penalty" (light green): Approximately 28
* "w/o penalty" (light blue): Approximately 32
* **IKG-40%:**
* "w/ penalty" (light green): Approximately 39
* "w/o penalty" (light blue): Approximately 40
* **IKG-60%:**
* "w/ penalty" (light green): Approximately 43
* "w/o penalty" (light blue): Approximately 43
**Trend:** Both "w/ penalty" and "w/o penalty" Web Search Frequencies increase as IKG increases from 20% to 60%.
**Hits@1 (Dashed Lines with Markers):**
* **IKG-20%:**
* "w/ penalty" (red square): Approximately 89
* "w/o penalty" (red triangle): Approximately 87
* **IKG-40%:**
* "w/ penalty" (red square): Approximately 86
* "w/o penalty" (red triangle): Approximately 84
* **IKG-60%:**
* "w/ penalty" (red square): Approximately 77
* "w/o penalty" (red triangle): Approximately 76
**Trend:** Both "w/ penalty" and "w/o penalty" Hits@1 decrease as IKG increases from 20% to 60%.
### Key Observations
* Web Search Frequency increases with IKG percentage, regardless of penalty.
* Hits@1 decreases with IKG percentage, regardless of penalty.
* The "w/o penalty" values are consistently slightly higher than the "w/ penalty" values for Web Search Frequency.
* The "w/ penalty" values are consistently slightly higher than the "w/o penalty" values for Hits@1.
### Interpretation
The chart suggests an inverse relationship between Web Search Frequency and Hits@1 as IKG increases. As the IKG percentage increases, the frequency of web searches increases, but the accuracy of the top result (Hits@1) decreases. The penalty seems to have a minor effect, slightly reducing Web Search Frequency and slightly increasing Hits@1. This could indicate that a higher IKG leads to more searches, but the quality of the top search result diminishes, possibly due to increased noise or less relevant results. The penalty might be a mechanism to refine search results, leading to slightly better top-result accuracy at the cost of some search frequency.