## Dual-Axis Combination Chart: Web Search Frequency vs. Hits@1 Across IKG Percentages
### Overview
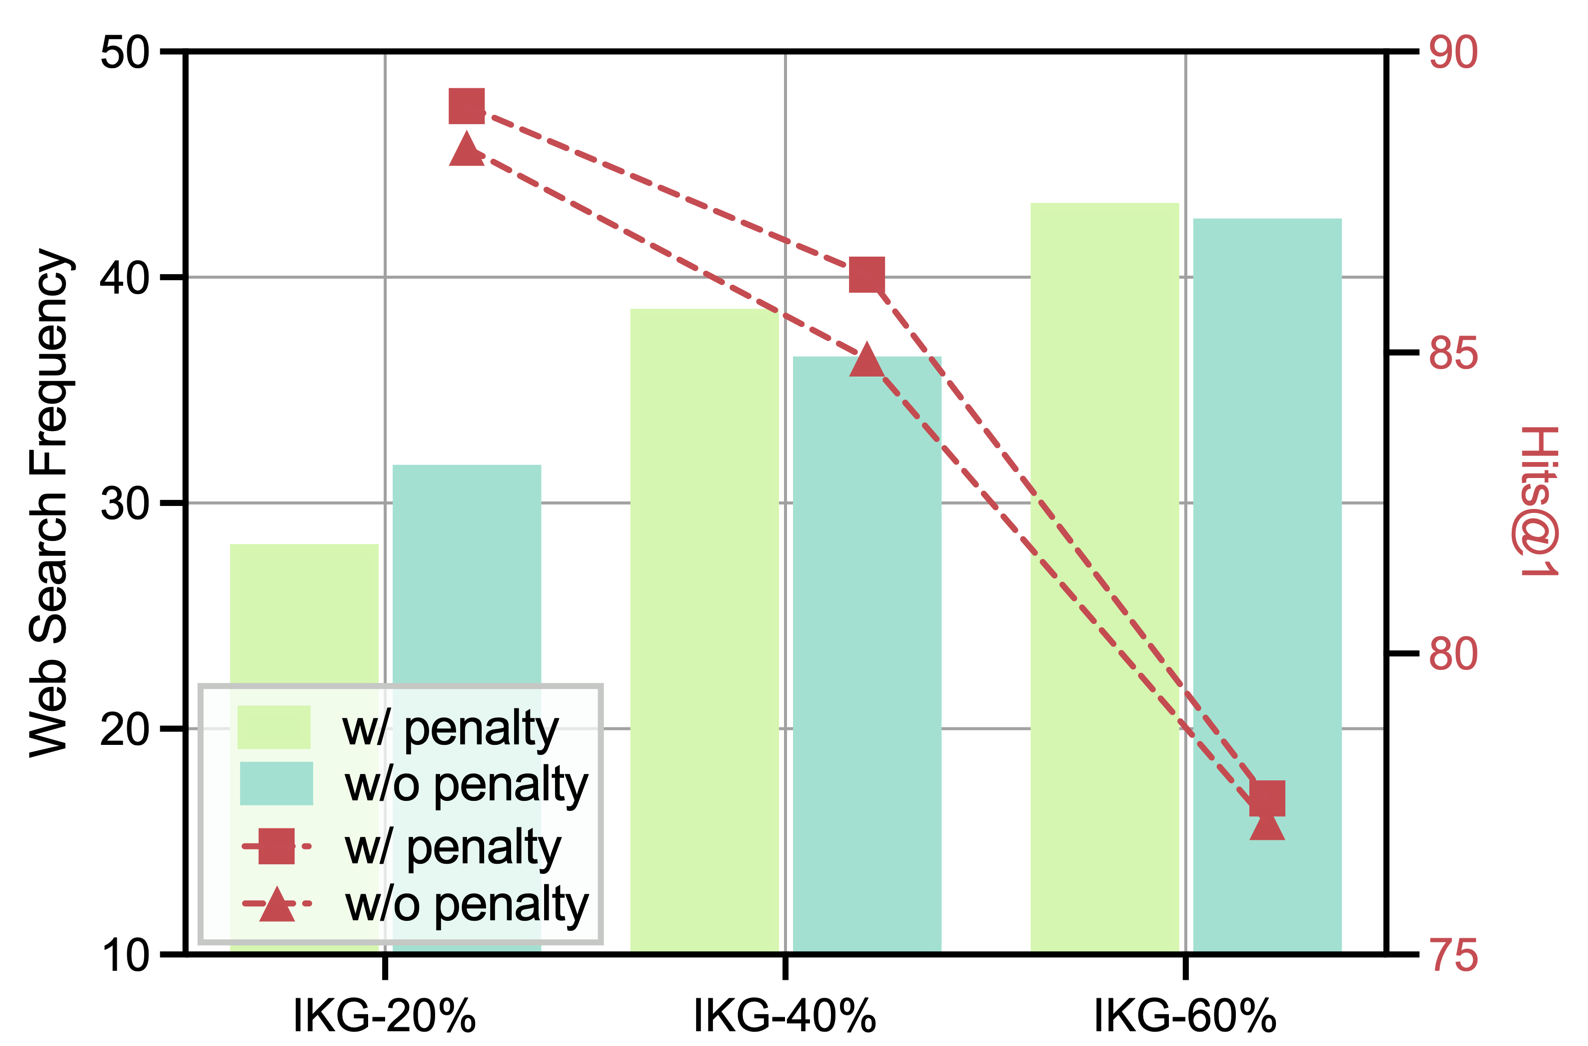
This image is a dual-axis combination chart displaying two distinct metrics—**Web Search Frequency** (represented by bars) and **Hits@1** (represented by dashed lines with markers)—across three categories on the x-axis: **IKG-20%**, **IKG-40%**, and **IKG-60%**. The chart compares performance "with penalty" and "without penalty" for both metrics.
### Components/Axes
* **X-Axis (Bottom):** Categorical axis with three labels: `IKG-20%`, `IKG-40%`, `IKG-60%`.
* **Primary Y-Axis (Left):** Labeled `Web Search Frequency`. Scale ranges from 10 to 50, with major gridlines at intervals of 10.
* **Secondary Y-Axis (Right):** Labeled `Hits@1` (text is red). Scale ranges from 75 to 90, with major ticks at 75, 80, 85, 90.
* **Legend (Bottom-Left):** Contains four entries:
1. Light green solid bar: `w/ penalty`
2. Teal solid bar: `w/o penalty`
3. Red dashed line with square marker: `w/ penalty`
4. Red dashed line with triangle marker: `w/o penalty`
* **Data Series:**
* **Bars (Web Search Frequency):** Two bars per x-axis category.
* **Lines (Hits@1):** Two dashed red lines connecting markers across the three categories.
### Detailed Analysis
**1. Web Search Frequency (Bars - Left Axis):**
* **Trend:** Both "w/ penalty" and "w/o penalty" series show a clear **upward trend** as the IKG percentage increases.
* **IKG-20%:**
* `w/ penalty` (Light Green): ~28
* `w/o penalty` (Teal): ~31.5
* **IKG-40%:**
* `w/ penalty` (Light Green): ~38.5
* `w/o penalty` (Teal): ~36.5
* **IKG-60%:**
* `w/ penalty` (Light Green): ~43
* `w/o penalty` (Teal): ~42.5
**2. Hits@1 (Lines - Right Axis):**
* **Trend:** Both "w/ penalty" and "w/o penalty" series show a clear **downward trend** as the IKG percentage increases.
* **IKG-20%:**
* `w/ penalty` (Square Marker): ~88.5
* `w/o penalty` (Triangle Marker): ~87.5
* **IKG-40%:**
* `w/ penalty` (Square Marker): ~86
* `w/o penalty` (Triangle Marker): ~85
* **IKG-60%:**
* `w/ penalty` (Square Marker): ~77
* `w/o penalty` (Triangle Marker): ~76.5
### Key Observations
1. **Inverse Relationship:** There is a strong inverse relationship between the two metrics. As **Web Search Frequency increases** with higher IKG percentages, the **Hits@1 score decreases**.
2. **Penalty Effect:** The "with penalty" condition consistently results in a slightly **higher Hits@1 score** than "without penalty" at each IKG level (the square marker line is above the triangle marker line). For Web Search Frequency, the relationship is less consistent; "w/ penalty" is lower at IKG-20%, higher at IKG-40%, and roughly equal at IKG-60%.
3. **Magnitude of Change:** The decline in Hits@1 is particularly steep between IKG-40% and IKG-60%, dropping approximately 9 points for the "w/ penalty" series.
### Interpretation
The chart suggests a fundamental trade-off in the system being measured. Increasing the IKG parameter (which could represent a knowledge graph integration level or a similar variable) leads to more frequent web searches but at the cost of reduced precision in the top result (Hits@1).
The "penalty" mechanism appears to be a tuning parameter that slightly improves precision (Hits@1) across all tested levels without dramatically altering the search frequency trend. The most significant finding is the sharp performance degradation in Hits@1 at the highest IKG level (60%), indicating a potential threshold where the system's ability to return the correct top result is severely compromised, even as it searches more frequently. This could imply that beyond a certain point, integrating more knowledge (or whatever IKG represents) introduces noise or complexity that hinders precise retrieval.