## Diagram: Sound Localization Model
### Overview
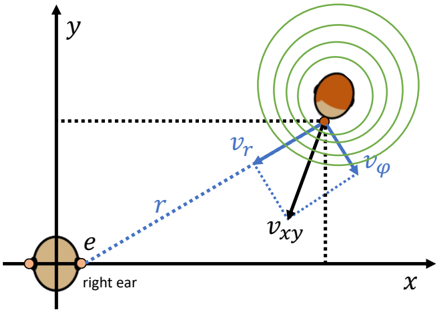
The image is a diagram illustrating a simplified model of sound localization, showing the relationship between a sound source, a listener's head, and the right ear. It uses a coordinate system to represent the spatial arrangement and vectors to represent sound propagation.
### Components/Axes
* **Axes:**
* x-axis: Horizontal axis, labeled "x".
* y-axis: Vertical axis, labeled "y".
* **Objects:**
* "right ear": Located at the origin (0,0) of the coordinate system, labeled "e".
* Head: Represented as a brown oval shape with a simplified ear on the right side, located in the upper-right quadrant. Green concentric circles emanate from the head, representing sound waves.
* **Vectors:**
* r: Dotted blue line representing the distance from the right ear to the sound source (head).
* vr: Solid blue arrow pointing from the head towards the bottom-left, representing a component of the sound velocity.
* vφ: Solid blue arrow pointing from the head towards the right, representing another component of the sound velocity.
* vxy: Solid black arrow pointing from the head towards the bottom-left, representing the combined sound velocity in the x-y plane.
* **Dotted Lines:**
* Horizontal dotted line: Extends from the head to the y-axis.
* Vertical dotted line: Extends from the head to the x-axis.
### Detailed Analysis
* The "right ear" is positioned at the origin (0,0).
* The head (sound source) is located in the upper-right quadrant.
* The distance "r" is represented by a dotted blue line connecting the right ear to the head.
* The sound velocity vector "vxy" is the resultant vector of "vr" and "vφ".
### Key Observations
* The diagram simplifies the sound localization process by focusing on the right ear and representing the sound source as emanating from the head.
* The vectors illustrate the decomposition of sound velocity into radial (vr) and tangential (vφ) components.
* The coordinate system provides a spatial reference for understanding the relative positions of the ear and the sound source.
### Interpretation
The diagram illustrates a simplified model of how sound localization might be conceptualized. The right ear is taken as a reference point, and the sound source (represented by the head) is located at a certain distance and direction. The sound velocity is decomposed into components, which could be related to the interaural time difference (ITD) and interaural level difference (ILD) cues used by the auditory system to localize sound. The diagram does not provide specific numerical data, but it serves as a visual representation of the spatial relationships and vector components involved in sound localization.