\n
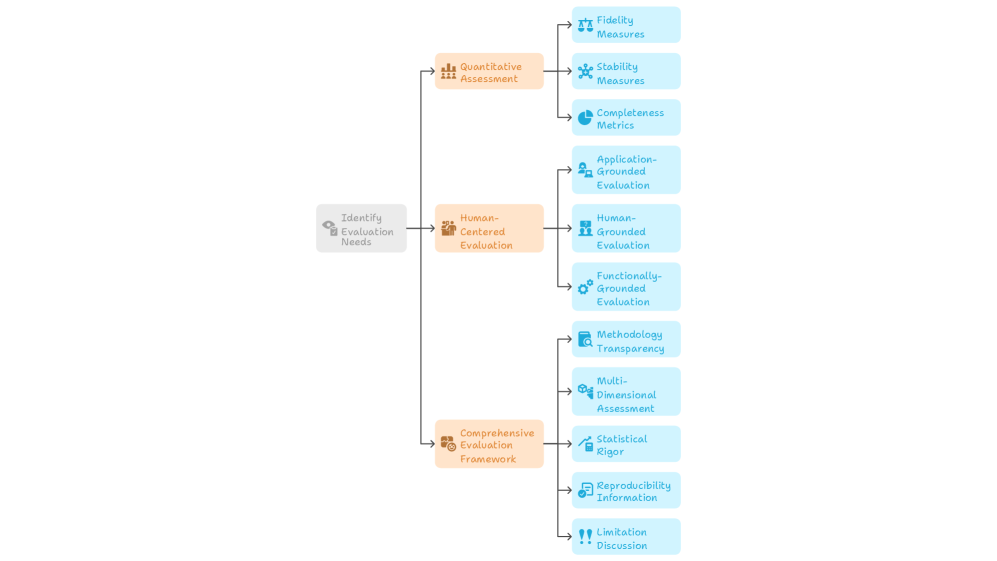
## Diagram: Evaluation Framework Flowchart
### Overview
This diagram illustrates a flowchart outlining an evaluation framework, starting from identifying evaluation needs and branching into quantitative assessment, human-centered evaluation, and a comprehensive evaluation framework. Each branch then expands into more specific evaluation methods and considerations. The diagram uses boxes to represent processes and arrows to indicate the flow of evaluation.
### Components/Axes
The diagram consists of the following key components:
* **Starting Point:** "Identify Evaluation Needs" (top-left)
* **Main Branches:** "Quantitative Assessment", "Human-Centered Evaluation", "Comprehensive Evaluation Framework"
* **Sub-Branches/Evaluation Methods:**
* From "Quantitative Assessment": "Fidelity Measures", "Stability Measures", "Completeness Metrics"
* From "Human-Centered Evaluation": "Application-Grounded Evaluation", "Human-Grounded Evaluation", "Functionally-Grounded Evaluation"
* From "Comprehensive Evaluation Framework": "Methodology Transparency", "Multi-Dimensional Assessment", "Statistical Rigor", "Reproducibility Information", "Limitation Discussion"
* **Icons:** Each box is accompanied by a small icon representing the type of evaluation.
### Detailed Analysis or Content Details
The diagram's flow can be described as follows:
1. **Identify Evaluation Needs:** The process begins with identifying the specific needs for evaluation.
2. **Branching Paths:** From this starting point, the evaluation can proceed along three main paths:
* **Quantitative Assessment (Yellow):** This path focuses on measurable aspects of the evaluation.
* **Fidelity Measures:** Assessing how closely the evaluation reflects real-world conditions.
* **Stability Measures:** Evaluating the consistency of the evaluation results.
* **Completeness Metrics:** Determining the extent to which the evaluation covers all relevant aspects.
* **Human-Centered Evaluation (Blue):** This path emphasizes the human perspective in the evaluation.
* **Application-Grounded Evaluation:** Evaluating the evaluation's relevance to real-world applications.
* **Human-Grounded Evaluation:** Focusing on the human experience and understanding during the evaluation.
* **Functionally-Grounded Evaluation:** Assessing the evaluation's focus on the functionality of the system being evaluated.
* **Comprehensive Evaluation Framework (Green):** This path aims for a holistic and thorough evaluation.
* **Methodology Transparency:** Ensuring the evaluation methodology is clear and understandable.
* **Multi-Dimensional Assessment:** Evaluating the system from multiple perspectives.
* **Statistical Rigor:** Applying statistical methods to ensure the validity of the evaluation results.
* **Reproducibility Information:** Providing information to allow others to reproduce the evaluation.
* **Limitation Discussion:** Acknowledging and discussing the limitations of the evaluation.
### Key Observations
The diagram presents a structured approach to evaluation, highlighting the importance of considering both quantitative and qualitative aspects. The branching structure suggests that the choice of evaluation methods depends on the specific needs identified at the beginning of the process. The inclusion of "Limitation Discussion" demonstrates a commitment to transparency and critical self-assessment.
### Interpretation
This diagram represents a systematic framework for conducting evaluations, likely in the context of user interface design, software development, or product development. The framework emphasizes a multi-faceted approach, acknowledging that a comprehensive evaluation requires considering quantitative metrics, human factors, and methodological rigor. The flow suggests a decision-making process where the initial identification of evaluation needs guides the selection of appropriate evaluation methods. The diagram's visual structure reinforces the idea that evaluation is not a single step but a series of interconnected processes. The use of different colors for each main branch (yellow, blue, green) likely serves to visually categorize the different evaluation approaches. The icons accompanying each box add a layer of visual communication, suggesting the specific type of evaluation being performed. The diagram is a high-level overview and does not provide specific details on how each evaluation method should be implemented.