\n
## Diagram: Evaluation Needs Framework
### Overview
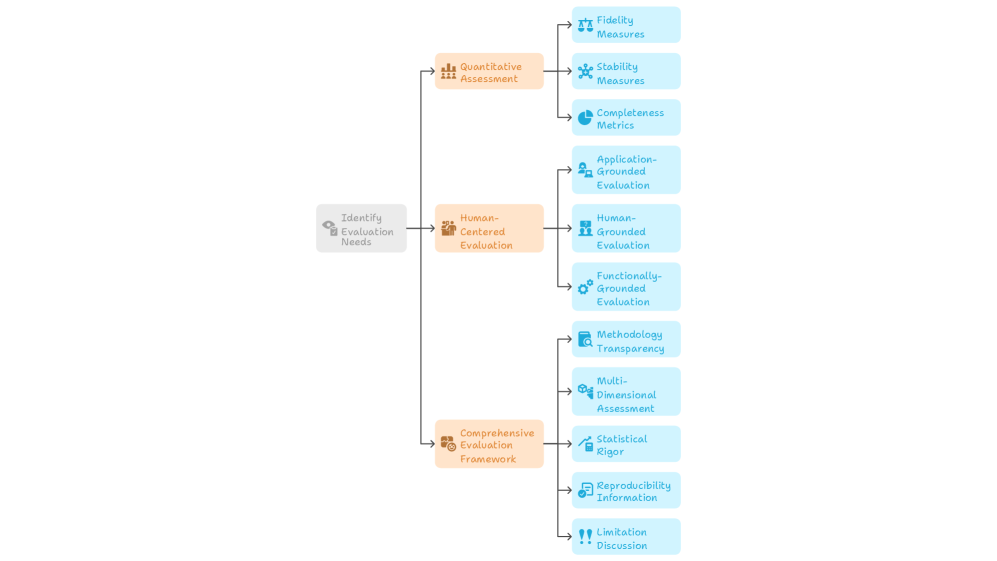
The image displays a hierarchical flowchart or mind map that outlines a structured framework for identifying and categorizing evaluation needs. The diagram flows from left to right, starting with a central objective that branches into three primary assessment approaches, each of which further subdivides into specific evaluation components or criteria. The visual uses a color-coded system with icons to differentiate between levels of the hierarchy.
### Components/Axes
The diagram is organized into three distinct hierarchical levels, connected by directional arrows indicating a flow from general to specific.
**Level 1 (Root Node):**
* **Position:** Left-center of the image.
* **Label:** "Identify Evaluation Needs"
* **Color:** Light gray box.
* **Icon:** A magnifying glass over a document.
**Level 2 (Primary Assessment Categories):**
Three orange boxes branch from the root node.
1. **Top Branch:** "Quantitative Assessment"
* **Icon:** A bar chart.
2. **Middle Branch:** "Human-Centered Evaluation"
* **Icon:** A group of people.
3. **Bottom Branch:** "Comprehensive Evaluation Framework"
* **Icon:** A clipboard with a checklist.
**Level 3 (Specific Components/Metrics):**
Each Level 2 category branches into several light blue boxes, representing specific evaluation dimensions.
* **From "Quantitative Assessment":**
1. "Fidelity Measures" (Icon: Scales)
2. "Stability Measures" (Icon: A star or spark)
3. "Completeness Metrics" (Icon: A pie chart)
* **From "Human-Centered Evaluation":**
1. "Application-Grounded Evaluation" (Icon: A person with a gear)
2. "Human-Grounded Evaluation" (Icon: Two people)
3. "Functionally-Grounded Evaluation" (Icon: A gear)
* **From "Comprehensive Evaluation Framework":**
1. "Methodology Transparency" (Icon: A document with an eye)
2. "Multi-Dimensional Assessment" (Icon: A cube or 3D shape)
3. "Statistical Rigor" (Icon: A line graph trending upward)
4. "Reproducibility Information" (Icon: Two circular arrows)
5. "Limitation Discussion" (Icon: An exclamation mark in a triangle)
### Detailed Analysis
The diagram presents a complete taxonomy for evaluation planning. The flow is strictly hierarchical and non-cyclical.
* **Spatial Grounding:** The legend (color and icon coding) is embedded directly within the diagram's structure. The root is gray, primary categories are orange, and specific components are blue. Icons are consistently placed to the left of each text label within their respective boxes.
* **Trend Verification:** As a structural diagram, there are no numerical trends. The "trend" is the logical decomposition from a broad goal ("Identify Evaluation Needs") into increasingly specific and actionable evaluation strategies and metrics.
* **Component Isolation:**
* **Header/Root:** The single starting point.
* **Main Body:** The three parallel branches representing distinct philosophical or methodological approaches to evaluation (quantitative, human-centered, comprehensive).
* **Leaves/Details:** The eleven specific blue boxes that constitute the actual checklist or framework components to be addressed.
### Key Observations
1. **Symmetry and Balance:** The framework is visually balanced, with the "Human-Centered Evaluation" branch placed centrally, suggesting it may be a core or integrative component between purely quantitative and broadly comprehensive approaches.
2. **Comprehensiveness:** The "Comprehensive Evaluation Framework" branch contains the most sub-components (5), indicating it is the most detailed or multifaceted category, encompassing procedural (Transparency, Reproducibility), analytical (Statistical Rigor, Multi-Dimensional), and reflective (Limitation Discussion) elements.
3. **Iconography:** Each label is paired with a simple, representative icon, aiding in quick visual recognition of the concept (e.g., scales for "Fidelity," people for "Human-Grounded").
### Interpretation
This diagram represents a **systematic and multi-faceted approach to evaluation design**, likely for a technical system, research study, or complex project. It argues that robust evaluation cannot rely on a single method.
* **What it suggests:** Effective evaluation requires starting from a clear identification of needs, then pursuing at least three parallel tracks: 1) objective, numerical measurement (**Quantitative**), 2) assessment based on user experience, context, and practical application (**Human-Centered**), and 3) a holistic framework ensuring methodological soundness, transparency, and critical self-assessment (**Comprehensive**).
* **Relationships:** The three Level-2 categories are presented as complementary, not mutually exclusive. A thorough evaluation plan would likely incorporate elements from all three branches. The "Comprehensive" branch acts as a meta-framework, ensuring the processes behind both the quantitative and human-centered evaluations are rigorous and credible.
* **Notable Implication:** The inclusion of "Limitation Discussion" and "Reproducibility Information" as explicit components highlights an understanding that evaluation is not just about reporting successes, but also about providing context, acknowledging boundaries, and enabling verification—a sign of mature scientific or engineering practice. This framework moves beyond simple metric reporting to advocate for a responsible and transparent evaluation culture.