## Flowchart: Evaluation Framework
### Overview
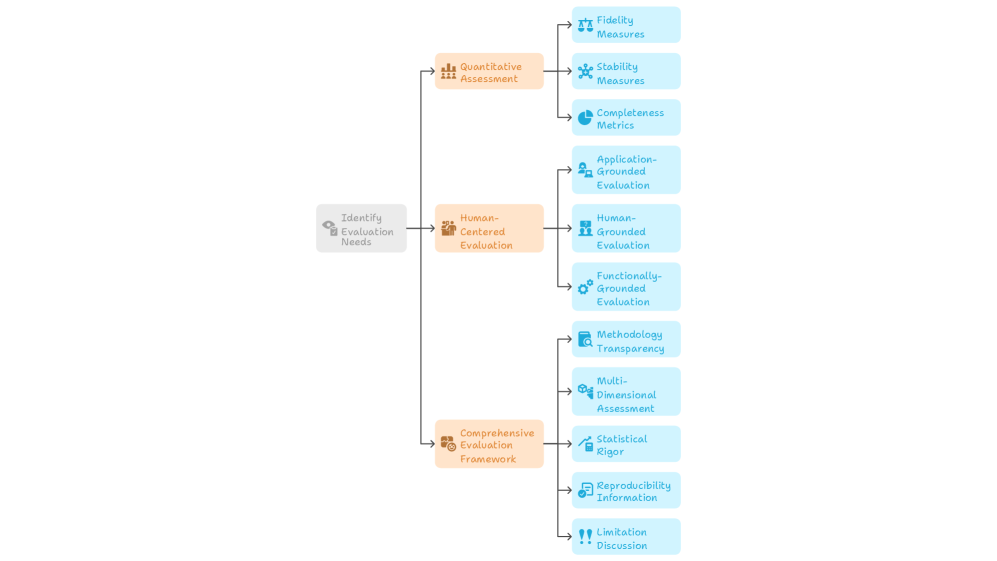
The flowchart illustrates a structured evaluation process beginning with "Identify Evaluation Needs" as the central node. From this node, three primary evaluation branches extend:
1. **Quantitative Assessment**
2. **Human-Centered Evaluation**
3. **Comprehensive Evaluation Framework**
Each branch further subdivides into specific evaluation criteria, emphasizing a multi-dimensional approach to assessment.
---
### Components/Axes
- **Central Node**: "Identify Evaluation Needs" (gray rectangle)
- **Primary Branches**:
- **Quantitative Assessment** (orange rectangle)
- **Human-Centered Evaluation** (orange rectangle)
- **Comprehensive Evaluation Framework** (orange rectangle)
- **Sub-Nodes**:
- **Quantitative Assessment** includes:
- Fidelity Measures
- Stability Measures
- Completeness Metrics
- **Human-Centered Evaluation** includes:
- Application-Grounded Evaluation
- Human-Grounded Evaluation
- Functionally-Grounded Evaluation
- **Comprehensive Evaluation Framework** includes:
- Methodology Transparency
- Multi-Dimensional Assessment
- Statistical Rigor
- Reproducibility Information
- Limitation Discussion
---
### Detailed Analysis
- **Flow Direction**:
- Arrows originate from the central node and branch outward to the three primary evaluation types.
- Each primary branch further subdivides into sub-nodes via arrows, creating a hierarchical structure.
- **Textual Labels**:
- All nodes use bold, sans-serif text with consistent formatting.
- Sub-nodes are indented under their parent branches for clarity.
- **Color Coding**:
- Central node: Gray (#D3D3D3)
- Primary branches: Orange (#F5F5DC)
- Sub-nodes: Blue (#ADD8E6)
---
### Key Observations
1. **Hierarchical Structure**: The flowchart emphasizes a top-down approach, starting with identifying needs and branching into specialized evaluation types.
2. **Comprehensiveness**: The "Comprehensive Evaluation Framework" branch is the most detailed, with five sub-nodes, suggesting it integrates multiple evaluation dimensions.
3. **Balance**: The inclusion of both quantitative (e.g., "Completeness Metrics") and human-centered criteria (e.g., "Human-Grounded Evaluation") ensures a balanced assessment.
4. **Transparency**: "Methodology Transparency" and "Reproducibility Information" highlight methodological rigor.
---
### Interpretation
The flowchart represents a systematic evaluation methodology designed to address diverse needs through:
- **Quantitative Metrics**: Objective measures like fidelity and stability.
- **Human-Centered Criteria**: Focus on user/application alignment.
- **Comprehensive Integration**: Combining transparency, multi-dimensional analysis, and reproducibility to ensure robust evaluations.
The structure implies that evaluations should begin with clear need identification, followed by tailored assessments across quantitative, human-centered, and comprehensive dimensions. The emphasis on reproducibility and limitation discussion underscores a commitment to methodological integrity and critical reflection. This framework is likely intended for complex systems requiring both data-driven and user-focused evaluation.