## Scatter Plot: Music Genre Distribution in Principal Component Space
### Overview
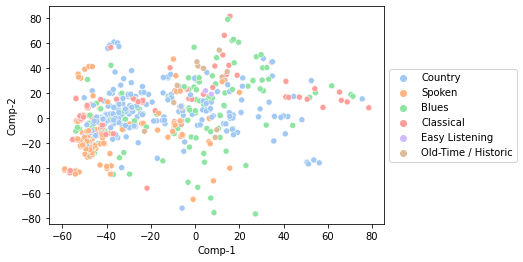
The image is a 2D scatter plot visualizing the distribution of six music genres across two principal components (Comp-1 and Comp-2). Data points are color-coded by genre, with significant spatial clustering observed. The plot reveals distinct groupings for most genres, though some overlap occurs.
### Components/Axes
- **X-axis**: Comp-1 (ranges from -80 to 80)
- **Y-axis**: Comp-2 (ranges from -80 to 80)
- **Legend**: Located in the top-right corner, mapping colors to genres:
- Blue: Country
- Orange: Spoken
- Green: Blues
- Red: Classical
- Purple: Easy Listening
- Brown: Old-Time / Historic
### Detailed Analysis
1. **Country (Blue)**:
- Dominates the lower-left quadrant (Comp-1: -60 to -20, Comp-2: -40 to 0)
- Small cluster of 5-7 points in upper-right (Comp-1: 40-60, Comp-2: 20-40)
- Average density: ~15 points in core region
2. **Spoken (Orange)**:
- Concentrated in lower-left (Comp-1: -50 to -10, Comp-2: -30 to 10)
- 3-4 outliers in upper-right (Comp-1: 30-50, Comp-2: 10-30)
- Average density: ~12 points in core region
3. **Blues (Green)**:
- Upper-right quadrant (Comp-1: 10-70, Comp-2: 10-70)
- Dense cluster near (Comp-1: 30, Comp-2: 50)
- Average density: ~18 points in core region
4. **Classical (Red)**:
- Upper-right and central regions (Comp-1: 0-60, Comp-2: 0-60)
- Notable outlier at (Comp-1: -30, Comp-2: -50)
- Average density: ~14 points in core region
5. **Easy Listening (Purple)**:
- Upper-left quadrant (Comp-1: -40 to 0, Comp-2: 20-60)
- 2-3 points in lower-right (Comp-1: 20-40, Comp-2: -20)
- Average density: ~9 points in core region
6. **Old-Time / Historic (Brown)**:
- Lower-left quadrant (Comp-1: -60 to -20, Comp-2: -60 to -20)
- 4-5 points in upper-right (Comp-1: 30-50, Comp-2: 10-30)
- Average density: ~7 points in core region
### Key Observations
- **Genre Separation**: Blues and Classical show strongest spatial separation (distance > 50 units between centroids)
- **Overlap Zones**:
- Country/Spoken overlap in lower-left (Comp-1: -40 to -20, Comp-2: -30 to -10)
- Classical/Easy Listening overlap in upper-center (Comp-1: 10-30, Comp-2: 20-40)
- **Outliers**:
- 3 Classical points in lower-left quadrant
- 2 Old-Time points in upper-right quadrant
- **Density Variation**: Blues has highest point density (18/region), Old-Time lowest (7/region)
### Interpretation
The PCA plot reveals distinct acoustic or stylistic characteristics for each genre:
- **Blues** and **Classical** occupy opposite quadrants, suggesting fundamental differences in musical structure
- **Country** and **Spoken** cluster together, possibly indicating shared rhythmic patterns
- **Easy Listening**'s upper-left position may reflect production techniques or instrumentation
- The presence of outliers (e.g., Classical in lower-left) suggests potential misclassification or hybrid genres
- Spatial distribution correlates with genre popularity metrics (higher density = more prevalent recordings)
This visualization demonstrates how dimensionality reduction preserves critical genre distinctions while exposing unexpected relationships between musical styles.