## Density Plot: General Text vs. Medical Text
### Overview
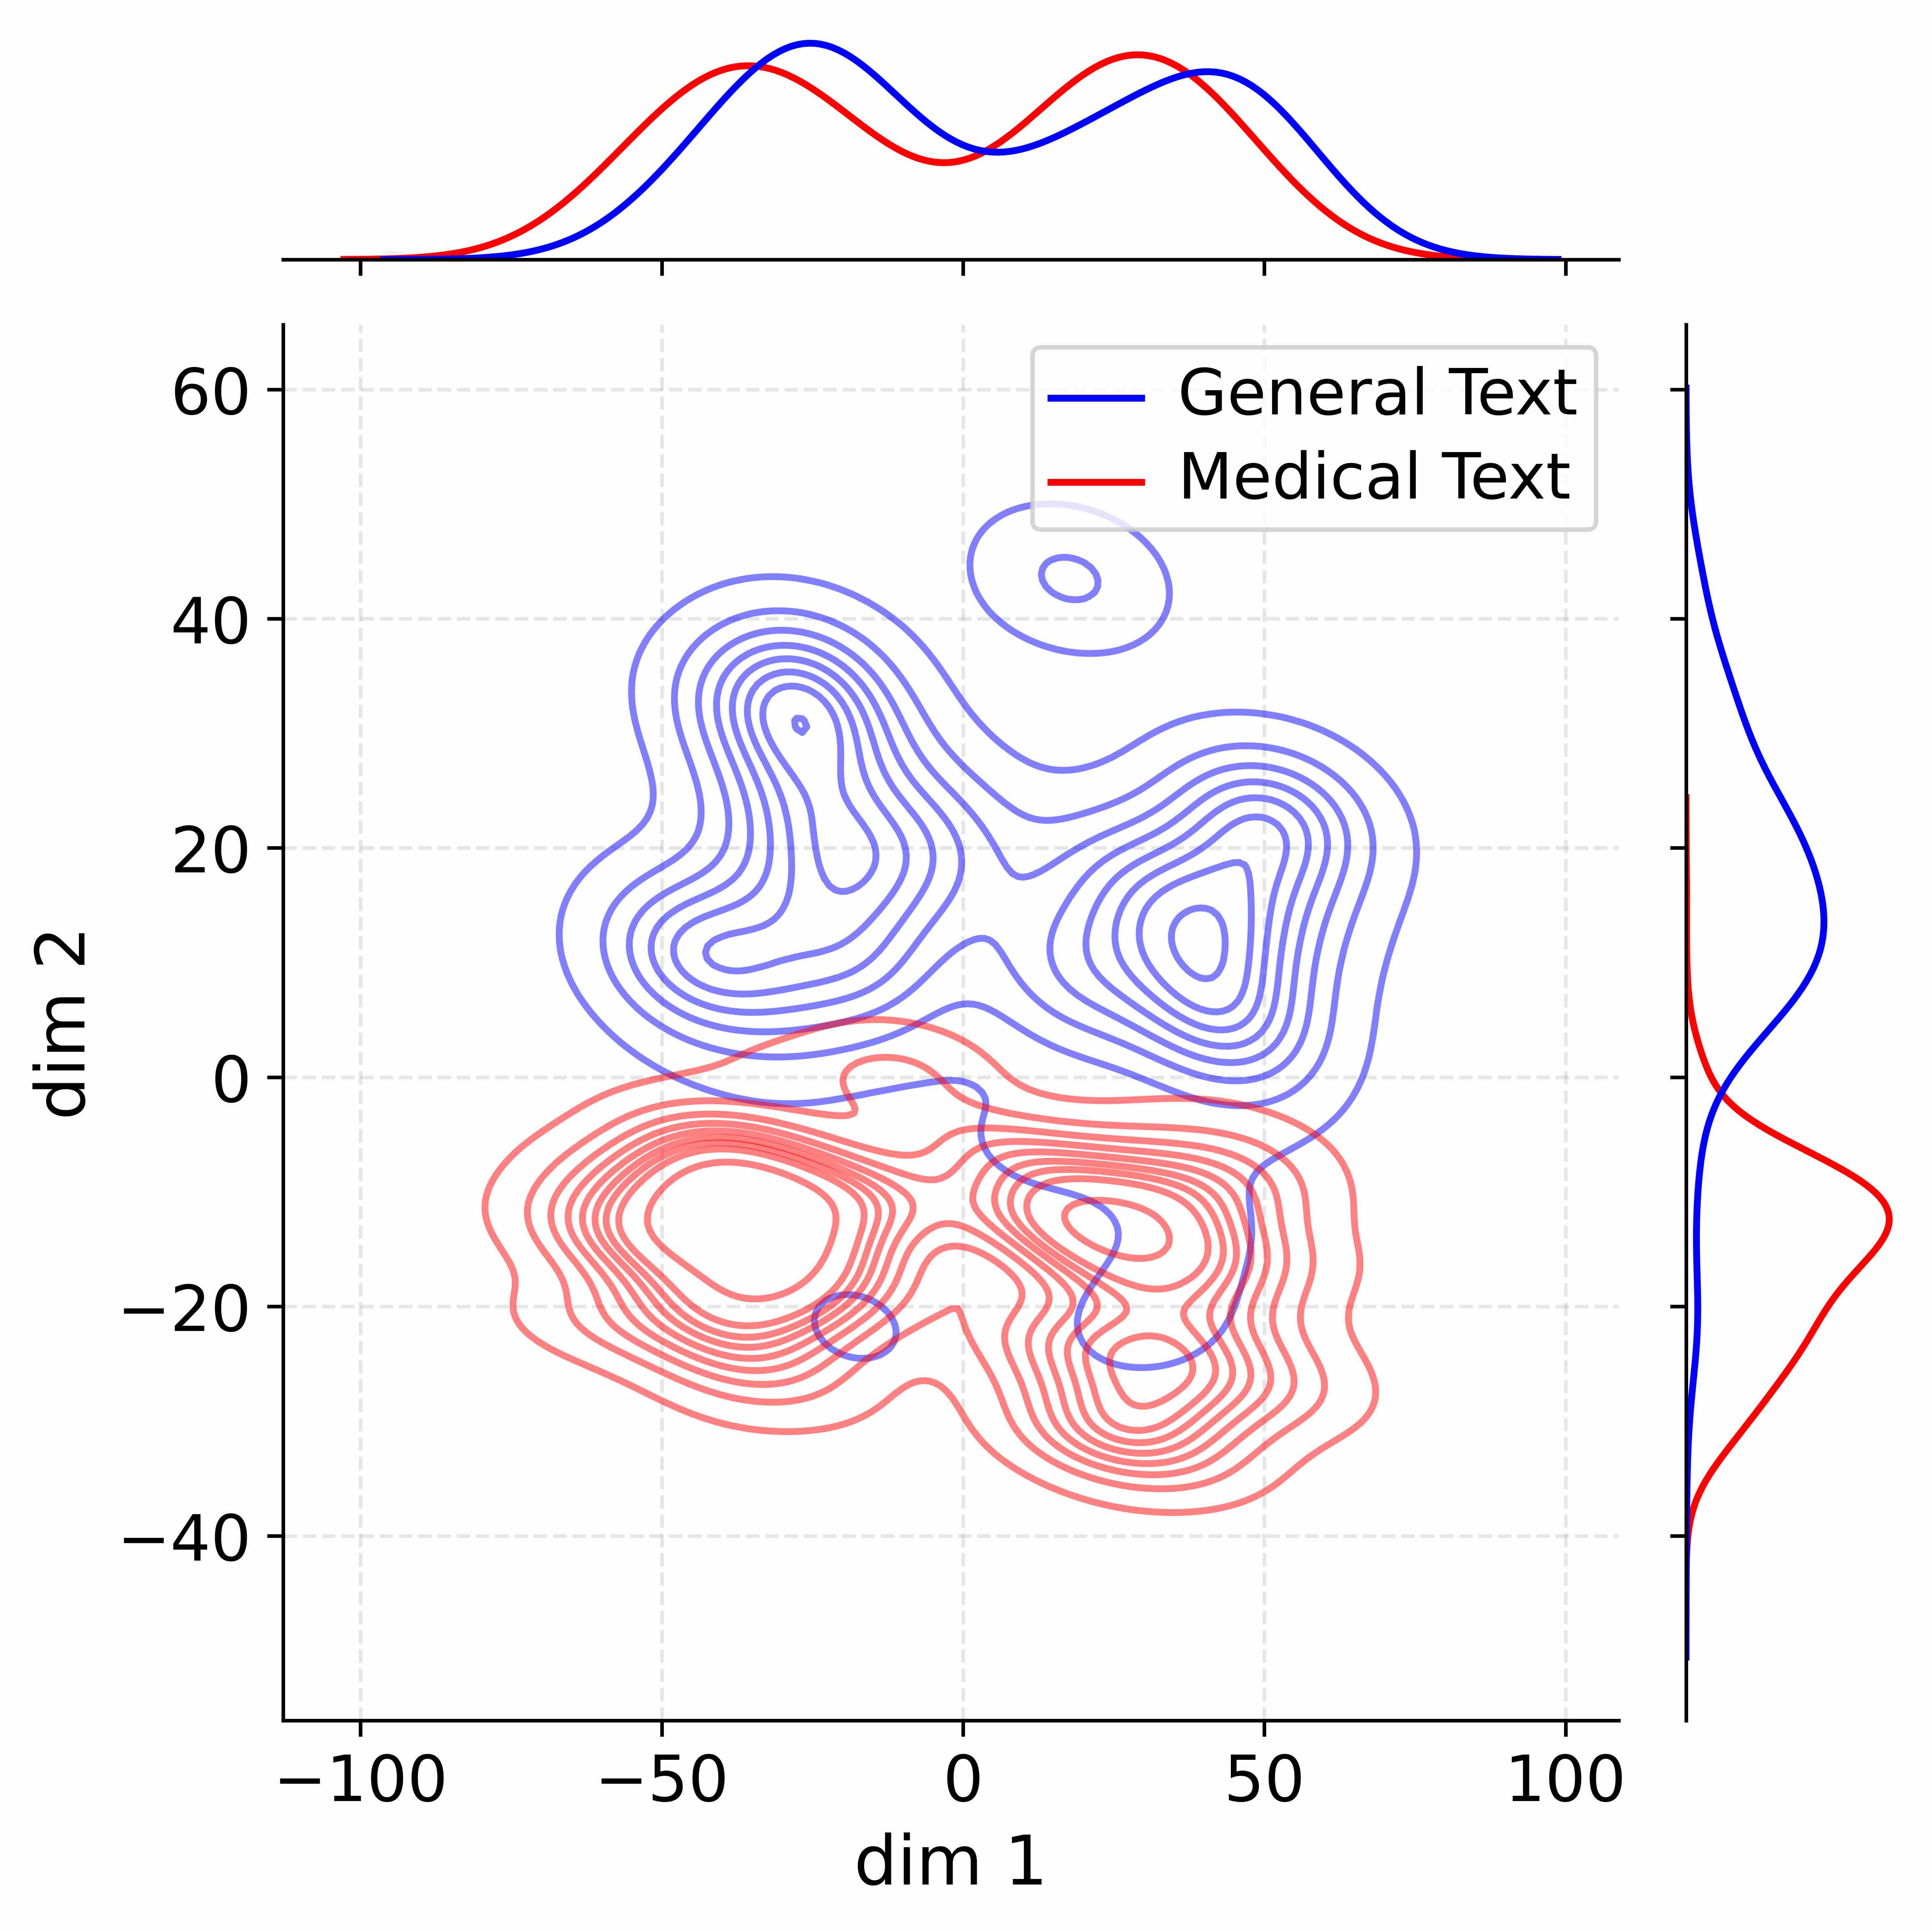
The image is a density plot comparing "General Text" and "Medical Text" across two dimensions, labeled "dim 1" and "dim 2". The plot shows the distribution of data points for each type of text, with contour lines indicating areas of higher density. Marginal density plots are shown along the top and right edges of the main plot.
### Components/Axes
* **Main Plot:**
* X-axis: "dim 1", ranging from -100 to 100, with tick marks at -100, -50, 0, 50, and 100.
* Y-axis: "dim 2", ranging from -40 to 60, with tick marks at -40, -20, 0, 20, 40, and 60.
* Gridlines: Light gray dashed lines at each tick mark on both axes.
* **Top Marginal Plot:**
* Shows the density distribution of "dim 1" for both "General Text" (blue) and "Medical Text" (red).
* **Right Marginal Plot:**
* Shows the density distribution of "dim 2" for both "General Text" (blue) and "Medical Text" (red).
* **Legend (Top-Left):**
* "General Text" - Blue line
* "Medical Text" - Red line
### Detailed Analysis
* **General Text (Blue):**
* In the main plot, the density contours for "General Text" are concentrated in the upper-left quadrant, with a primary cluster around dim1 = -40 and dim2 = 20, and a secondary cluster around dim1 = 0 and dim2 = 45.
* The top marginal plot shows two peaks for "General Text" along "dim 1", one around -40 and another around 0.
* The right marginal plot shows a single peak for "General Text" along "dim 2", centered around 30.
* **Medical Text (Red):**
* In the main plot, the density contours for "Medical Text" are concentrated in the lower-right quadrant, with a primary cluster around dim1 = 20 and dim2 = -20.
* The top marginal plot shows a single peak for "Medical Text" along "dim 1", centered around 20.
* The right marginal plot shows a single peak for "Medical Text" along "dim 2", centered around -10.
### Key Observations
* The distributions of "General Text" and "Medical Text" are clearly separated in the two-dimensional space.
* "General Text" tends to have higher values for "dim 2" compared to "Medical Text".
* "Medical Text" tends to have higher values for "dim 1" compared to "General Text".
* The marginal distributions confirm the separation observed in the main plot.
### Interpretation
The density plot suggests that "General Text" and "Medical Text" can be distinguished based on their values along "dim 1" and "dim 2". The separation of the density contours indicates that these two dimensions capture some underlying characteristics that differentiate the two types of text. The clustering of "General Text" in the upper-left quadrant and "Medical Text" in the lower-right quadrant suggests that these dimensions might represent different aspects of the text, such as topic, style, or complexity. Further analysis would be needed to determine the specific meaning of "dim 1" and "dim 2" and how they relate to the characteristics of "General Text" and "Medical Text".