\n
## Density Plot: Dimensionality Reduction of Text Data
### Overview
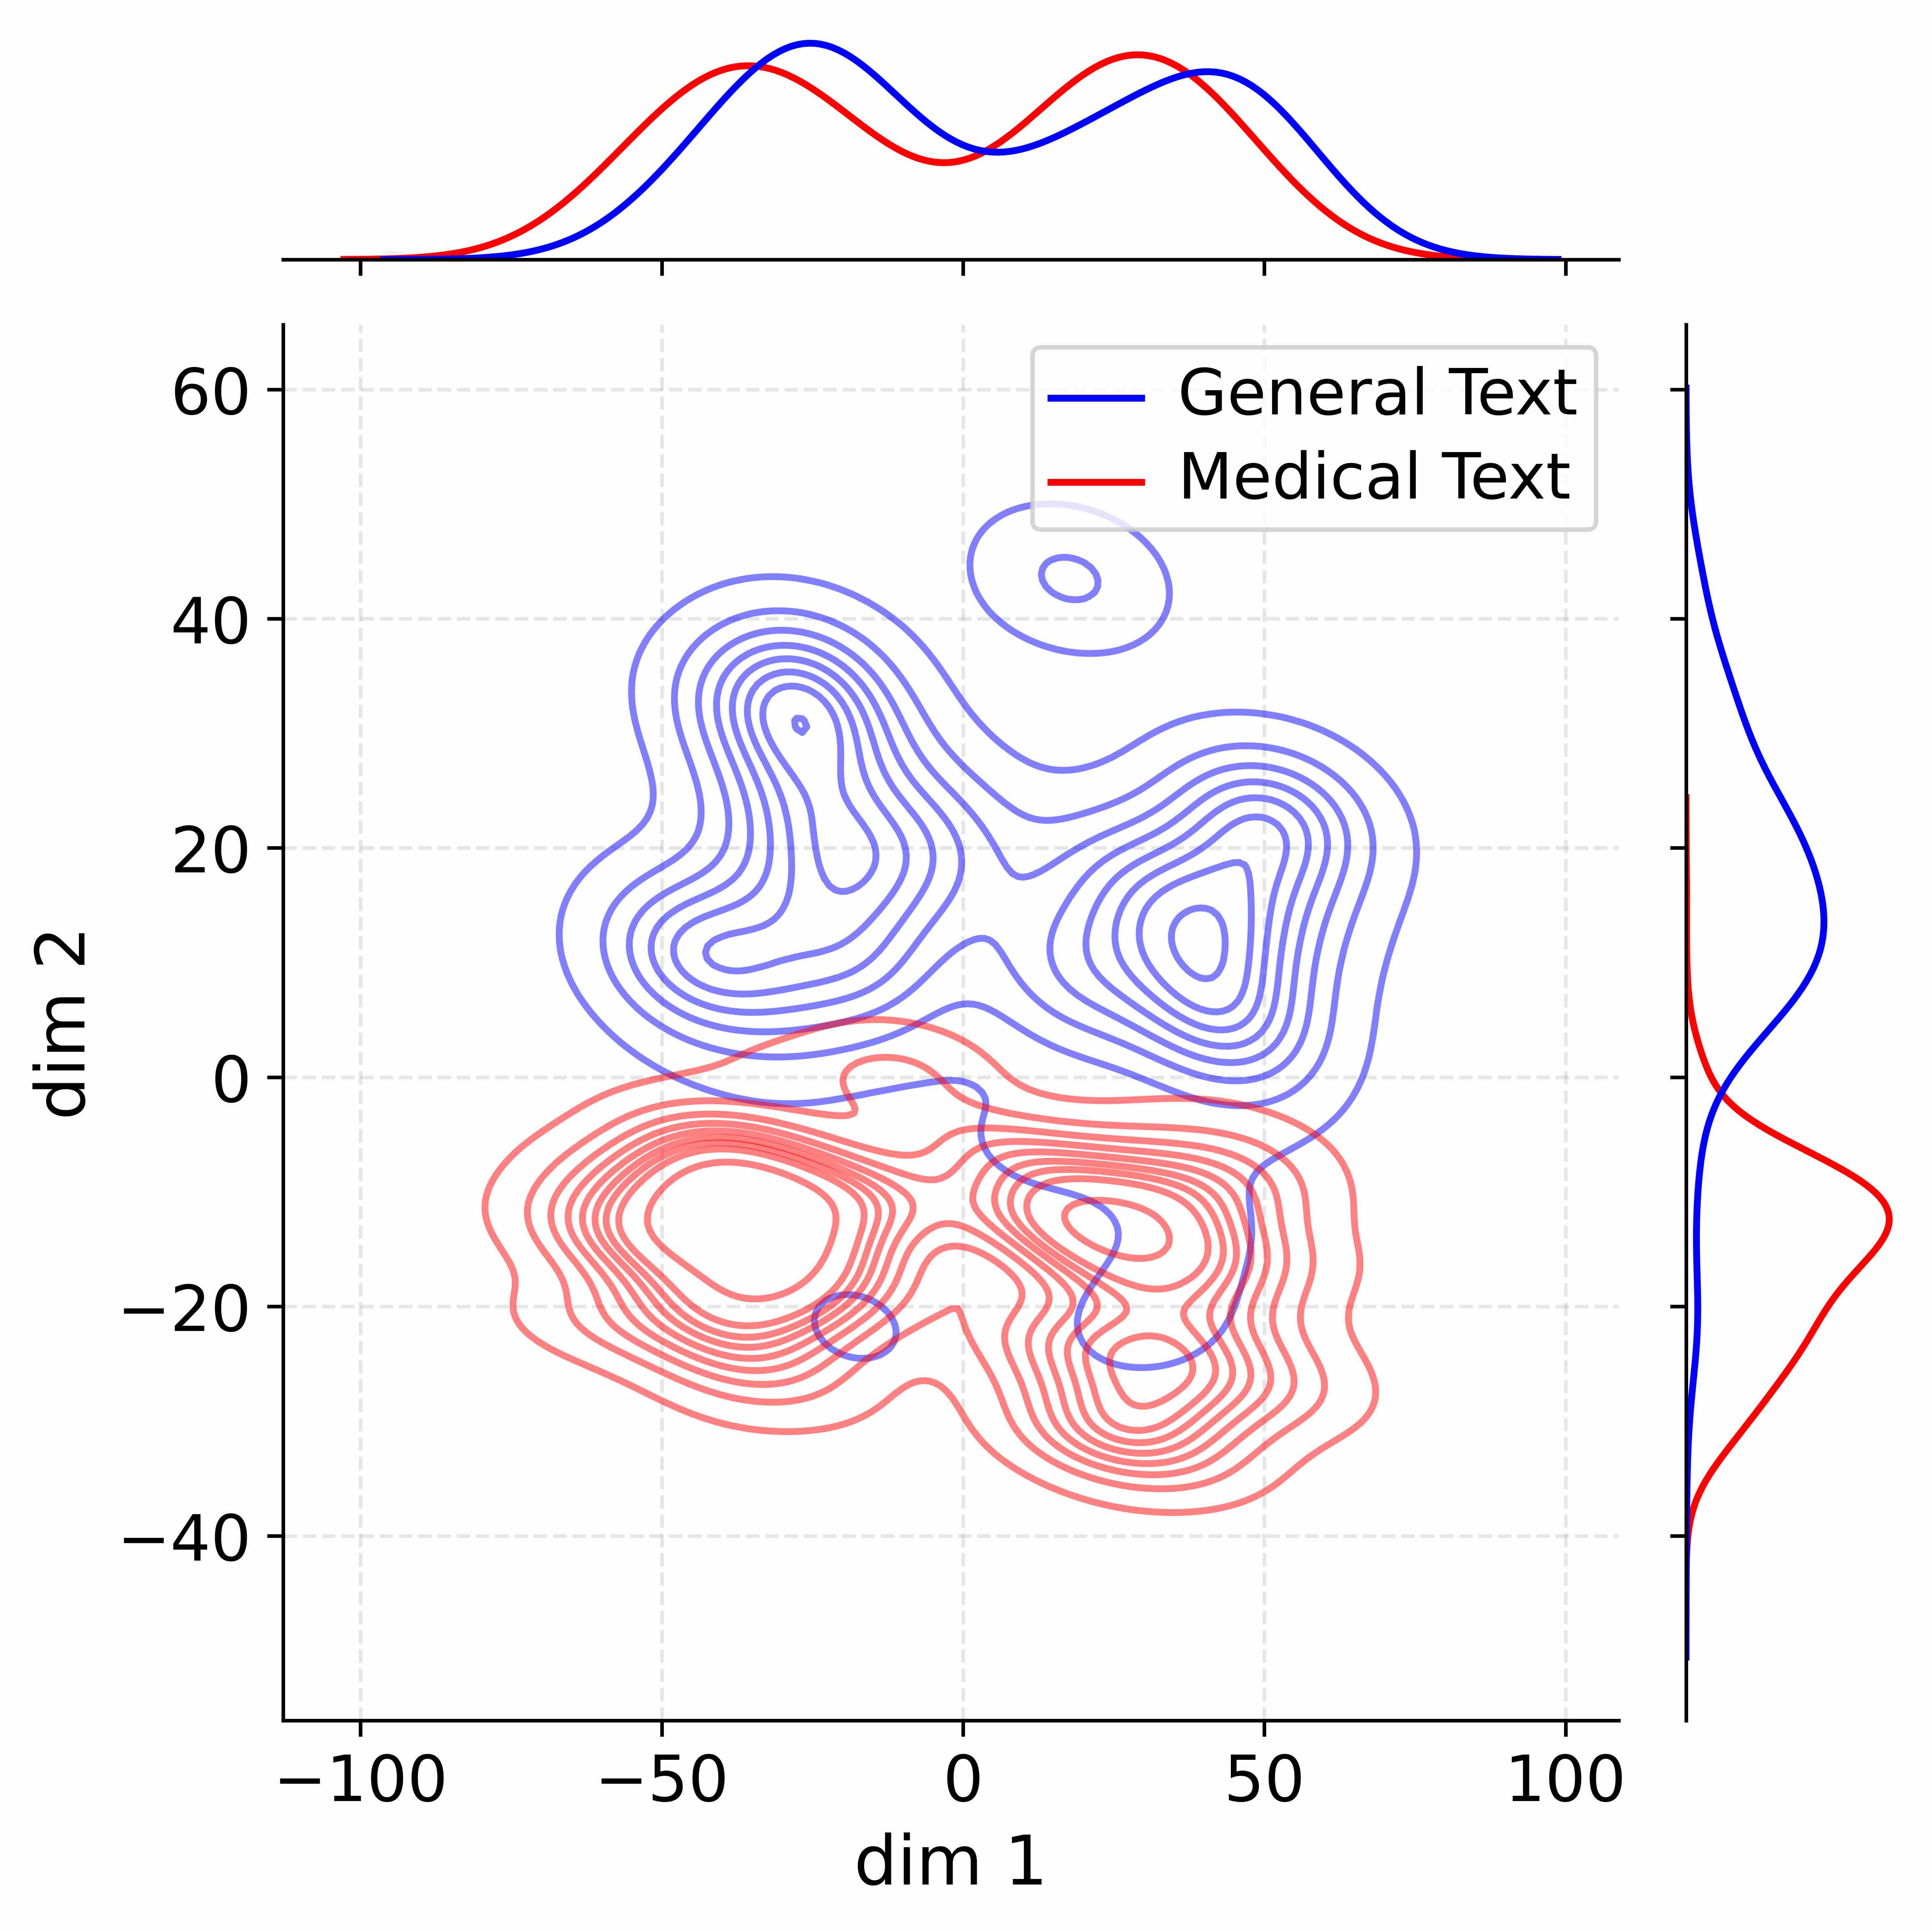
The image presents a 2D density plot resulting from dimensionality reduction, likely using techniques like t-SNE or UMAP. The plot visualizes the distribution of two classes of text data: "General Text" and "Medical Text". Marginal distributions (histograms) are shown along the top edge, representing the density of each class along each dimension.
### Components/Axes
* **X-axis:** Labeled "dim 1" (Dimension 1), ranging from approximately -100 to 100.
* **Y-axis:** Labeled "dim 2" (Dimension 2), ranging from approximately -50 to 60.
* **Density Contours:** Represent the concentration of data points for each class.
* **Legend:** Located in the top-right corner, distinguishing between "General Text" (blue) and "Medical Text" (red).
* **Marginal Distributions:** Histograms positioned above the main plot, showing the distribution of each class along dim 1 and dim 2.
### Detailed Analysis
The plot shows a clear separation between the two classes, although with significant overlap.
**General Text (Blue):**
* The density is concentrated in a broad, elongated region centered around (0, 20).
* The density extends from approximately dim 1 = -60 to dim 1 = 50, and from dim 2 = -10 to dim 2 = 50.
* The marginal distribution for dim 1 shows a peak around dim 1 = 0, with a slight negative skew.
* The marginal distribution for dim 2 shows a peak around dim 2 = 20.
**Medical Text (Red):**
* The density is concentrated in a more compact region, primarily in the lower-left quadrant, centered around (-30, -20).
* The density extends from approximately dim 1 = -80 to dim 1 = 10, and from dim 2 = -50 to dim 2 = 0.
* The marginal distribution for dim 1 shows a peak around dim 1 = -30.
* The marginal distribution for dim 2 shows a peak around dim 2 = -20.
* There is a smaller cluster of Medical Text density around (40, -30).
**Marginal Distributions:**
* The marginal distribution for General Text (blue) along dim 1 peaks at approximately 0, with values decreasing towards -100 and 100.
* The marginal distribution for General Text (blue) along dim 2 peaks at approximately 20, with values decreasing towards -50 and 60.
* The marginal distribution for Medical Text (red) along dim 1 peaks at approximately -30, with values decreasing towards -100 and 10.
* The marginal distribution for Medical Text (red) along dim 2 peaks at approximately -20, with values decreasing towards -50 and 0.
### Key Observations
* The two classes are partially separable in this reduced dimensional space.
* There is significant overlap between the two classes, indicating that the dimensionality reduction does not perfectly separate them.
* The Medical Text class appears to have a more distinct and localized distribution than the General Text class.
* The smaller cluster of Medical Text around (40, -30) suggests a sub-group within the Medical Text data that is different from the main cluster.
### Interpretation
This plot suggests that the two classes of text ("General Text" and "Medical Text") exhibit different characteristics in the reduced dimensional space. The dimensionality reduction technique has successfully captured some of the underlying structure in the data, allowing for partial separation of the classes. However, the overlap indicates that the distinction between the two classes is not absolute, and there is some ambiguity in classifying text based on these dimensions alone.
The presence of the smaller cluster within the Medical Text data suggests that there may be sub-categories or different types of medical text that are more distinct from the general text than others. Further analysis could investigate the characteristics of this sub-cluster to understand what makes it unique.
The marginal distributions provide additional insight into the distribution of each class along each dimension. The peaks and shapes of these distributions can be used to characterize the typical values of each dimension for each class. The fact that the distributions are not perfectly symmetrical suggests that the dimensions are not independent and may be correlated with other features of the text data.