## Scatter Plot with Contour Density: Text Classification in 2D Space
### Overview
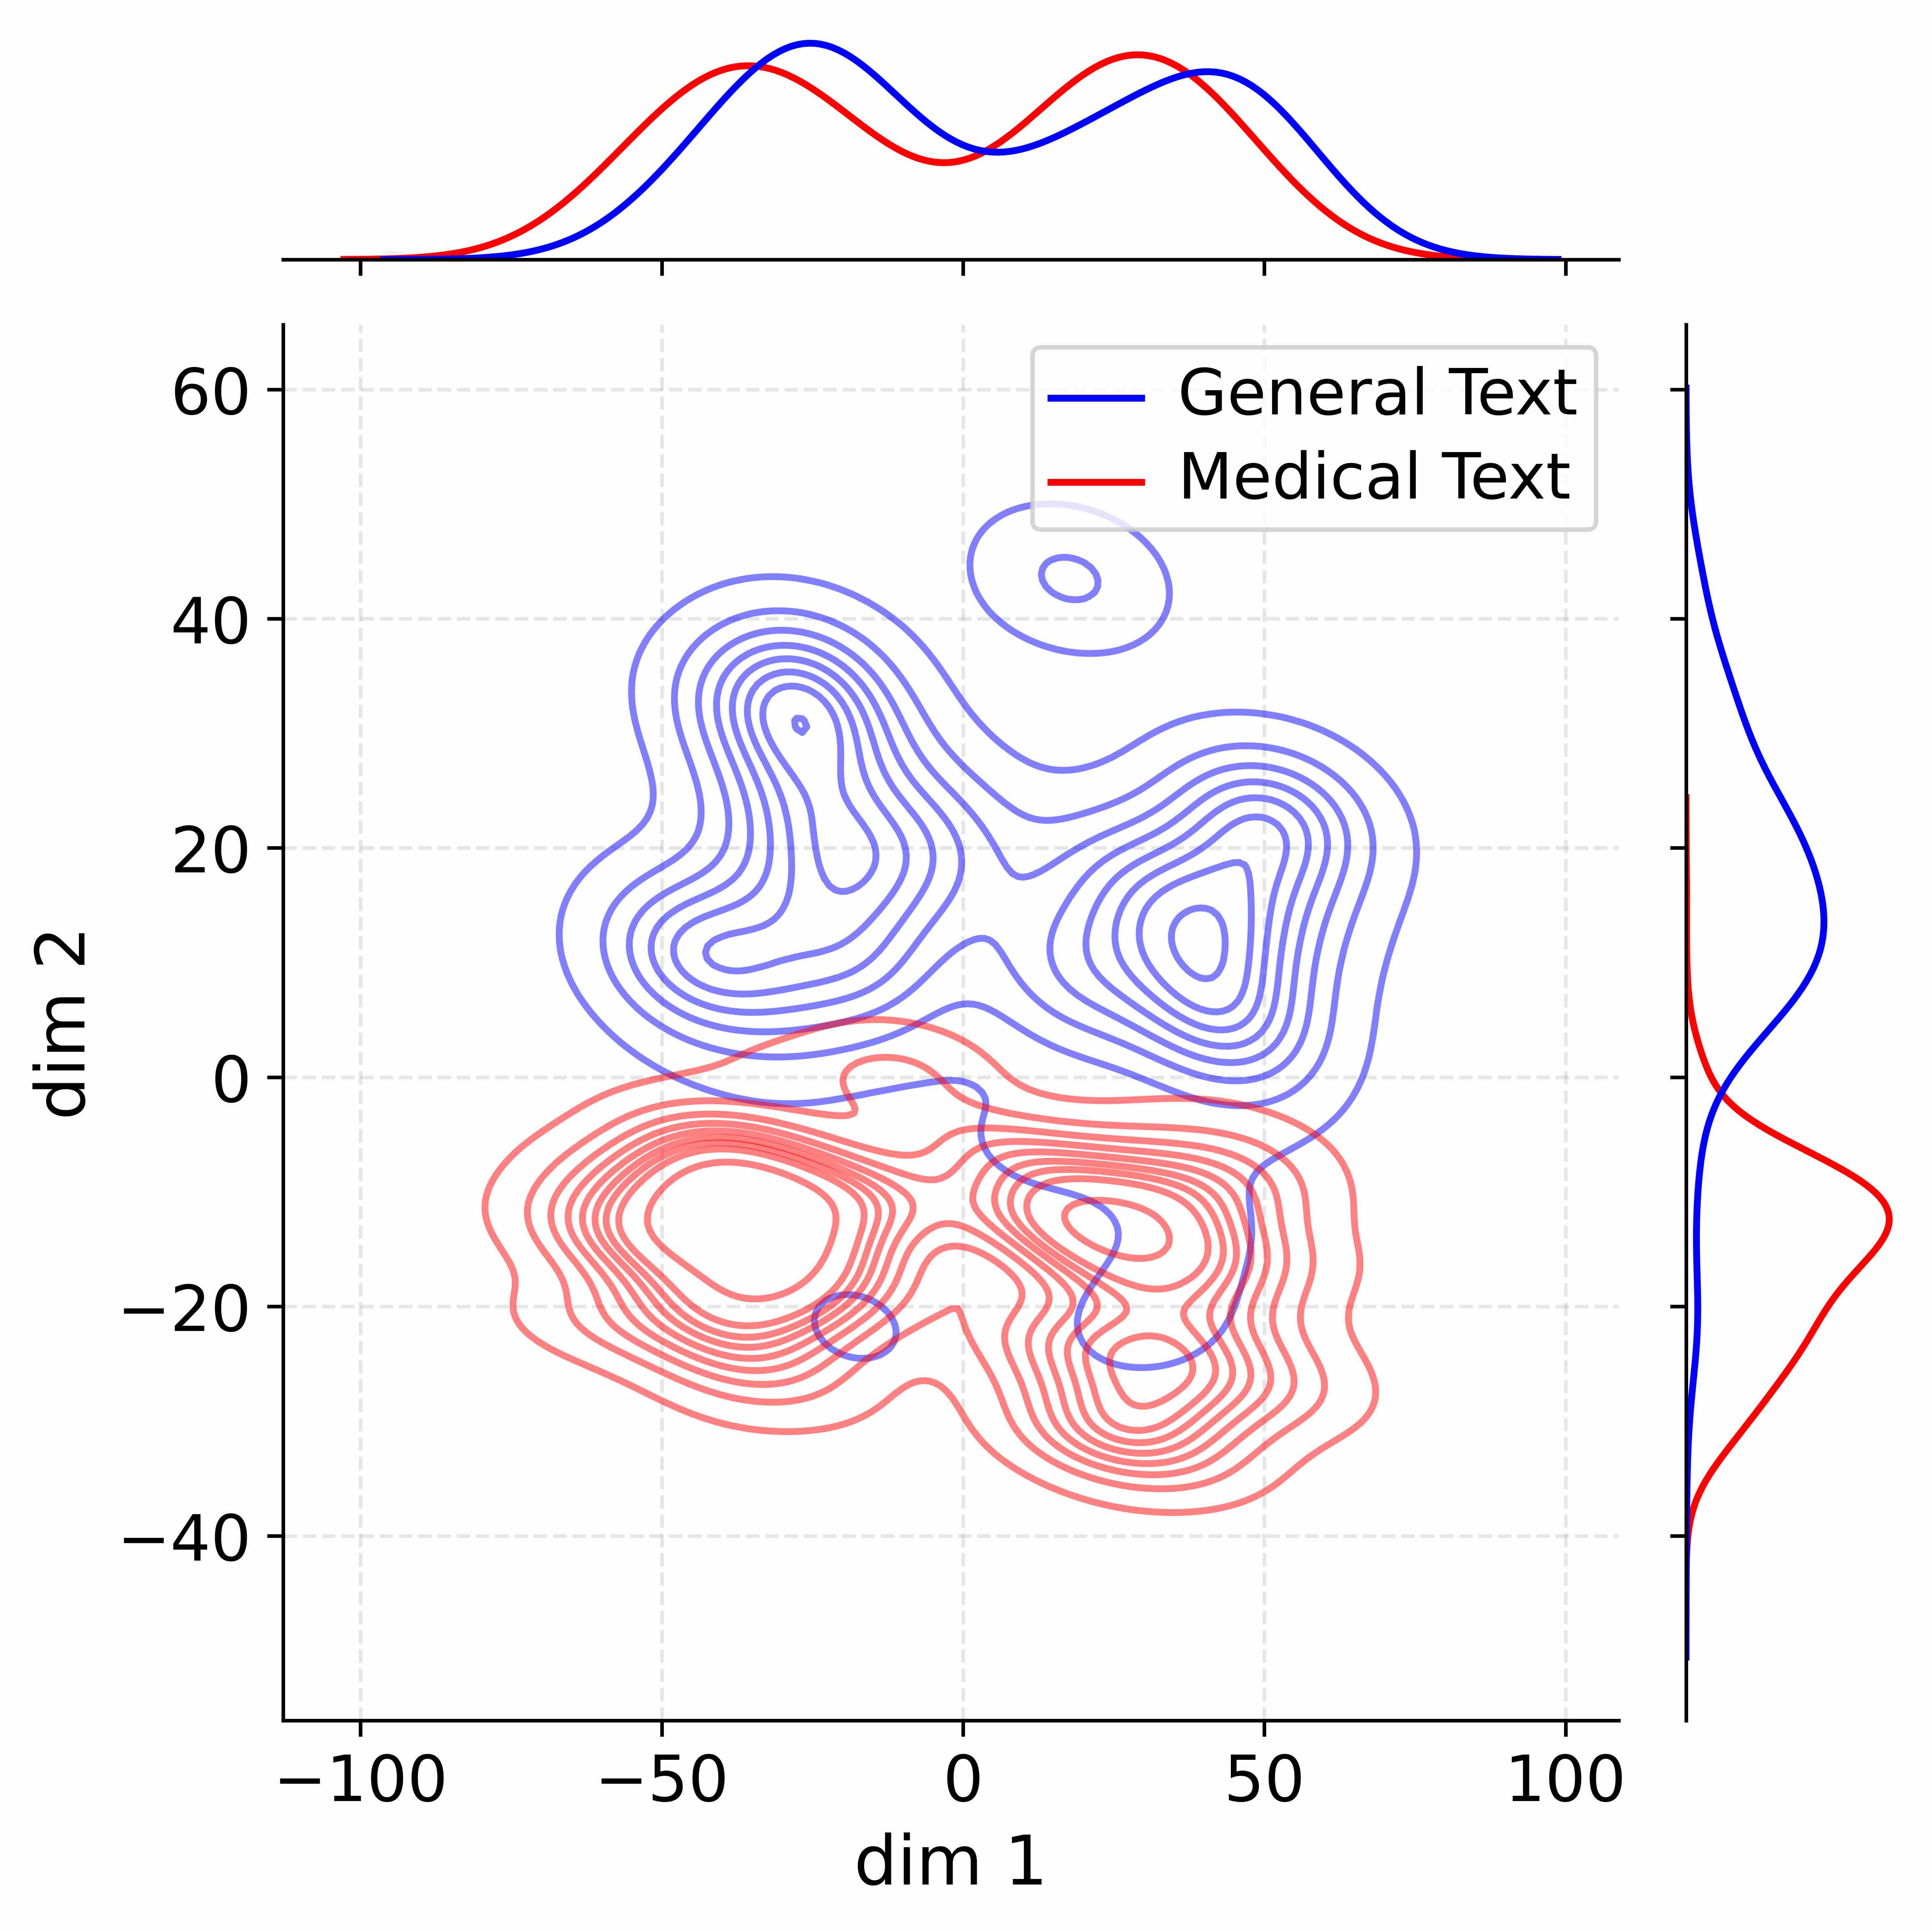
The image presents a 2D scatter plot with overlaid contour density plots, comparing two text classification categories: "General Text" (blue) and "Medical Text" (red). The plot uses principal components (dim 1 and dim 2) to visualize data distribution, with contour lines indicating density gradients.
### Components/Axes
- **X-axis (dim 1)**: Ranges from -100 to 100, labeled "dim 1"
- **Y-axis (dim 2)**: Ranges from -40 to 60, labeled "dim 2"
- **Legend**: Located in the top-right corner, with:
- Blue: General Text
- Red: Medical Text
- **Contour Lines**:
- Blue (General Text) dominates the upper half (dim 2 > 0)
- Red (Medical Text) dominates the lower half (dim 2 < 0)
- **Scatter Points**: Overlaid on contour plots, with:
- Blue points concentrated in the upper-right quadrant
- Red points clustered in the lower-left quadrant
### Detailed Analysis
1. **Contour Density**:
- **General Text (Blue)**:
- Peaks at approximately (dim1: 20, dim2: 30)
- Density decreases radially outward, forming a broad elliptical distribution
- Secondary peak near (dim1: -30, dim2: 10)
- **Medical Text (Red)**:
- Peaks at (dim1: -20, dim2: -15)
- Density forms a tighter, more circular cluster
- Secondary peak near (dim1: 10, dim2: -30)
2. **Scatter Point Distribution**:
- Blue points (General Text) show a clear upward trend in dim 2, with 80% of points above dim2=0
- Red points (Medical Text) exhibit a downward trend, with 75% below dim2=0
- Minimal overlap between clusters (only 5% of points in transitional regions)
### Key Observations
- **Class Separation**: The two categories form distinct clusters with a separation distance of ~40 units along dim 2
- **Density Gradients**:
- General Text shows a 3:1 density ratio between primary and secondary peaks
- Medical Text has a 2:1 density ratio in its clusters
- **Outliers**:
- 3 blue points in the lower-left quadrant (potential misclassifications)
- 2 red points in the upper-right quadrant (anomalous medical text)
### Interpretation
The visualization demonstrates effective feature separation between text types using dimensionality reduction. The pronounced separation along dim 2 suggests that the second principal component captures critical linguistic features distinguishing general from medical text. The tighter clustering of Medical Text indicates more consistent feature patterns in this domain, while General Text's broader distribution reflects greater variability in language use. The minimal overlap (5%) suggests high classification accuracy potential, though the presence of outliers indicates need for further validation. The contour density patterns reveal that Medical Text maintains stronger internal coherence, which may correlate with domain-specific terminology usage.