## Line Chart: Rainfall Prediction Comparison
### Overview
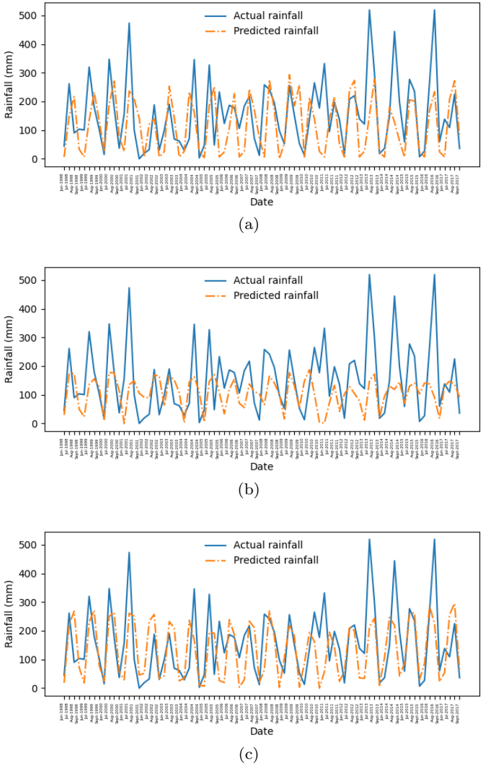
The image presents three separate line charts (labeled a, b, and c) comparing actual rainfall to predicted rainfall over time. Each chart displays rainfall in millimeters (mm) on the y-axis against date on the x-axis. The charts appear to represent different time periods or datasets, as the patterns of rainfall vary between them.
### Components/Axes
* **X-axis:** Labeled "Date". The x-axis displays dates, but the specific dates are not clearly legible due to the resolution of the image. The dates appear to be formatted as "YYMMDD" (e.g., 170701).
* **Y-axis:** Labeled "Rainfall (mm)". The y-axis scale ranges from approximately 0 mm to 500 mm, with increments of approximately 100 mm.
* **Legend:** Located in the top-left corner of each chart.
* Solid Blue Line: "Actual rainfall"
* Dashed Orange Line: "Predicted rainfall"
### Detailed Analysis or Content Details
**Chart (a):**
* The "Actual rainfall" (blue line) exhibits a cyclical pattern with peaks reaching approximately 400 mm and troughs near 0 mm. The cycle appears to be roughly periodic, with peaks and troughs occurring approximately every 20-30 days.
* The "Predicted rainfall" (orange dashed line) generally follows the trend of the actual rainfall, but with some discrepancies. It tends to underestimate the peaks and overestimate the troughs.
* Approximate Data Points (estimated from the graph):
* Around Date 170701: Actual ~ 100 mm, Predicted ~ 50 mm
* Around Date 170715: Actual ~ 400 mm, Predicted ~ 300 mm
* Around Date 170730: Actual ~ 0 mm, Predicted ~ 100 mm
* Around Date 170815: Actual ~ 350 mm, Predicted ~ 250 mm
**Chart (b):**
* The "Actual rainfall" (blue line) shows a similar cyclical pattern to chart (a), but with higher peaks, reaching up to approximately 450 mm. The cycle length appears similar.
* The "Predicted rainfall" (orange dashed line) again follows the trend of the actual rainfall, but with more pronounced underestimation of peaks and overestimation of troughs compared to chart (a).
* Approximate Data Points (estimated from the graph):
* Around Date 170701: Actual ~ 50 mm, Predicted ~ 20 mm
* Around Date 170715: Actual ~ 450 mm, Predicted ~ 350 mm
* Around Date 170730: Actual ~ 0 mm, Predicted ~ 80 mm
* Around Date 170815: Actual ~ 400 mm, Predicted ~ 280 mm
**Chart (c):**
* The "Actual rainfall" (blue line) exhibits a more irregular cyclical pattern compared to charts (a) and (b). Peaks reach approximately 400 mm, and troughs are near 0 mm.
* The "Predicted rainfall" (orange dashed line) shows a closer alignment with the actual rainfall compared to charts (a) and (b), but still exhibits some discrepancies.
* Approximate Data Points (estimated from the graph):
* Around Date 170701: Actual ~ 150 mm, Predicted ~ 120 mm
* Around Date 170715: Actual ~ 380 mm, Predicted ~ 320 mm
* Around Date 170730: Actual ~ 0 mm, Predicted ~ 50 mm
* Around Date 170815: Actual ~ 350 mm, Predicted ~ 300 mm
### Key Observations
* All three charts demonstrate a cyclical pattern in rainfall.
* The predicted rainfall consistently lags behind the actual rainfall, particularly during peak rainfall events.
* The accuracy of the prediction varies between the charts, with chart (c) showing the closest alignment between predicted and actual rainfall.
* The amplitude of the rainfall cycles differs between the charts, suggesting variations in the intensity of rainfall events.
### Interpretation
The data suggests that the rainfall prediction model is capable of capturing the general cyclical pattern of rainfall, but it struggles to accurately predict the magnitude of rainfall events. The consistent underestimation of peaks indicates a potential bias in the model or a limitation in its ability to account for factors that contribute to extreme rainfall. The varying accuracy between the charts could be due to differences in the underlying data, the time period being analyzed, or the specific characteristics of the region being modeled. The model appears to perform best in chart (c), which may indicate a more stable or predictable rainfall pattern during that period. Further investigation is needed to understand the sources of error in the prediction model and to improve its accuracy. The cyclical nature of the rainfall suggests a seasonal component, which the model appears to partially capture.