## Line Graph: Rouge-L vs Exact Score vs RE-Adapter Strength
### Overview
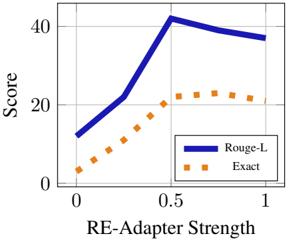
The image is a line graph comparing two metrics ("Rouge-L" and "Exact") across a normalized scale of "RE-Adapter Strength" (0 to 1). The y-axis represents a "Score" metric (0 to 40), while the x-axis represents the strength of an RE-Adapter parameter. Two data series are plotted: a solid blue line for "Rouge-L" and a dashed orange line for "Exact."
### Components/Axes
- **X-axis (Horizontal)**: Labeled "RE-Adapter Strength," with markers at 0, 0.5, and 1.0.
- **Y-axis (Vertical)**: Labeled "Score," with increments from 0 to 40.
- **Legend**: Located in the bottom-right corner, with:
- Solid blue line: "Rouge-L"
- Dashed orange line: "Exact"
- **Gridlines**: Subtle gridlines divide the plot into a 4x8 grid for reference.
### Detailed Analysis
#### Rouge-L (Solid Blue Line)
- **Trend**:
- Starts at approximately **10** when RE-Adapter Strength = 0.
- Increases sharply to **40** at RE-Adapter Strength = 0.5.
- Slightly declines to **35** at RE-Adapter Strength = 1.0.
- **Key Data Points**:
- (0, ~10)
- (0.5, ~40)
- (1.0, ~35)
#### Exact (Dashed Orange Line)
- **Trend**:
- Starts near **0** at RE-Adapter Strength = 0.
- Rises to **~20** at RE-Adapter Strength = 0.5.
- Remains flat at **~20** at RE-Adapter Strength = 1.0.
- **Key Data Points**:
- (0, ~0)
- (0.5, ~20)
- (1.0, ~20)
### Key Observations
1. **Rouge-L** exhibits a non-linear relationship with RE-Adapter Strength, peaking at 0.5 before a minor decline.
2. **Exact** shows a linear increase up to 0.5, then plateaus, indicating diminishing returns beyond this threshold.
3. The **Rouge-L** score is consistently higher than **Exact** across all RE-Adapter Strength values.
4. The **Rouge-L** curve suggests an optimal performance at mid-strength (0.5), while **Exact** performance saturates early.
### Interpretation
The graph demonstrates that **Rouge-L** is more sensitive to changes in RE-Adapter Strength, achieving its maximum score at 0.5 strength before a slight degradation. In contrast, **Exact** shows a linear improvement up to 0.5 strength, after which its score stabilizes. This implies that **Rouge-L** may be more responsive to parameter tuning in this context, while **Exact** has a simpler, more predictable relationship with the adapter strength. The divergence between the two metrics highlights potential trade-offs in model design or evaluation criteria.