## Line Chart: ξ and α Values Across Layer Indices
### Overview
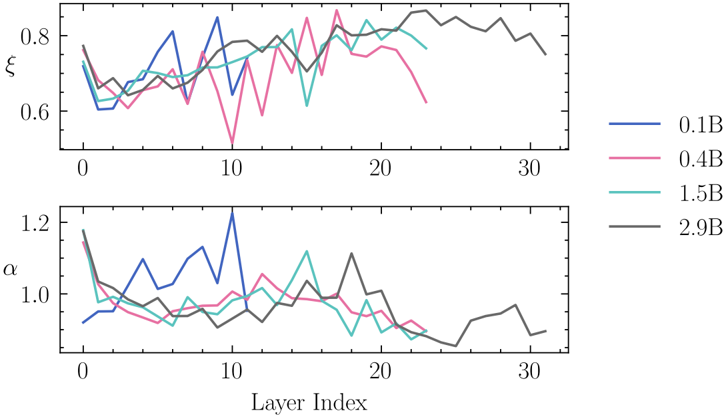
The image contains two line graphs stacked vertically, each plotting a metric (ξ and α) against a "Layer Index" (0–30). Four data series are represented by distinct colored lines, each corresponding to a specific "B" value (0.1B, 0.4B, 1.5B, 2.9B). The graphs show fluctuating trends with notable variability across layers.
### Components/Axes
- **X-axis**: "Layer Index" (0–30), incrementing by 10.
- **Y-axes**:
- Top graph: ξ (range: 0.6–0.8).
- Bottom graph: α (range: 1.0–1.2).
- **Legend**: Located on the right, with four entries:
- Blue: 0.1B
- Pink: 0.4B
- Cyan: 1.5B
- Black: 2.9B
### Detailed Analysis
#### Top Graph (ξ):
- **Black line (2.9B)**: Most stable, with minor fluctuations. Starts near 0.75, dips to ~0.65 at layer 10, and ends ~0.7.
- **Blue line (0.1B)**: Highly volatile, with sharp peaks (e.g., ~0.8 at layer 5) and troughs (e.g., ~0.6 at layer 15).
- **Pink line (0.4B)**: Moderate fluctuations, peaking at ~0.75 (layer 10) and dipping to ~0.6 (layer 20).
- **Cyan line (1.5B)**: Smoothest trend, starting ~0.7, peaking ~0.75 (layer 15), and ending ~0.7.
#### Bottom Graph (α):
- **Black line (2.9B)**: Stable, starting ~1.0, dipping to ~0.95 (layer 10), and ending ~0.9.
- **Blue line (0.1B)**: Extreme volatility, peaking at ~1.2 (layer 5) and dropping to ~0.9 (layer 25).
- **Pink line (0.4B)**: Erratic, with peaks (~1.1 at layer 10) and troughs (~0.95 at layer 20).
- **Cyan line (1.5B)**: Moderate fluctuations, starting ~1.0, peaking ~1.1 (layer 15), and ending ~1.0.
### Key Observations
1. **Stability vs. Volatility**: The 2.9B (black) line is the most stable in both graphs, while 0.1B (blue) exhibits the highest variability.
2. **Layer-Specific Trends**:
- ξ peaks for 0.1B occur at layer 5, while α peaks for 0.1B occur at layer 5.
- 1.5B (cyan) shows gradual increases in ξ (layer 15) and α (layer 15).
3. **Convergence**: All lines converge near layer 30, with ξ and α values stabilizing.
### Interpretation
The data suggests that higher "B" values (e.g., 2.9B) correlate with greater stability in both ξ and α metrics, while lower "B" values (e.g., 0.1B) result in pronounced fluctuations. This could indicate that "B" acts as a damping or stabilizing parameter in the system being modeled. The convergence at layer 30 implies a potential equilibrium or normalization effect at higher layer indices. The erratic behavior of 0.1B and 0.4B lines might reflect sensitivity to initial conditions or external perturbations in the system.