## Line Graph: N=10, CIFAR-100
### Overview
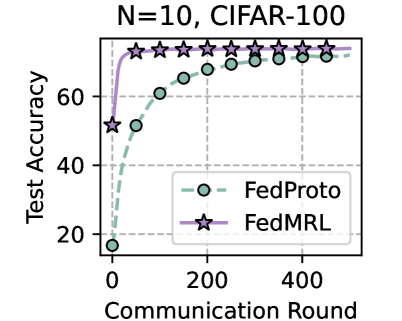
The image is a line graph comparing the test accuracy of two federated learning algorithms, **FedProto** and **FedMRL**, over communication rounds on the CIFAR-100 dataset with N=10 clients. The y-axis represents test accuracy (%), and the x-axis represents communication rounds (0–400). Both algorithms show increasing accuracy with more rounds, but FedMRL consistently outperforms FedProto.
---
### Components/Axes
- **Y-Axis**: "Test Accuracy" (%), scaled from 0 to 80 in increments of 20.
- **X-Axis**: "Communication Round", scaled from 0 to 400 in increments of 200.
- **Legend**: Located at the bottom-right corner.
- **FedProto**: Dashed teal line with hollow circles (data points).
- **FedMRL**: Solid purple line with star markers (data points).
---
### Detailed Analysis
1. **FedProto**:
- Starts at **~15%** accuracy at 0 rounds.
- Increases sharply to **~60%** by 200 rounds.
- Plateaus near **~70%** by 400 rounds.
- Data points: (0, ~15), (200, ~60), (400, ~70).
2. **FedMRL**:
- Starts at **~55%** accuracy at 0 rounds.
- Rises to **~75%** by 200 rounds.
- Maintains **~75%** accuracy at 400 rounds.
- Data points: (0, ~55), (200, ~75), (400, ~75).
---
### Key Observations
- **FedMRL** achieves higher accuracy than **FedProto** at all communication rounds.
- **FedProto** shows a steeper initial improvement but plateaus earlier.
- Both algorithms converge near 400 rounds, but FedMRL retains a **~5% accuracy advantage**.
- No outliers or anomalies; trends are smooth and consistent.
---
### Interpretation
The graph demonstrates that **FedMRL** is more efficient and effective than **FedProto** for this task. FedMRL achieves higher accuracy with fewer communication rounds, suggesting superior model architecture or optimization. The convergence at 400 rounds implies that while FedProto improves significantly over time, FedMRL’s performance is more stable and robust. This could inform algorithm selection in resource-constrained federated learning scenarios.