## Line Chart: EGA vs Episode for Different Initial Conditions
### Overview
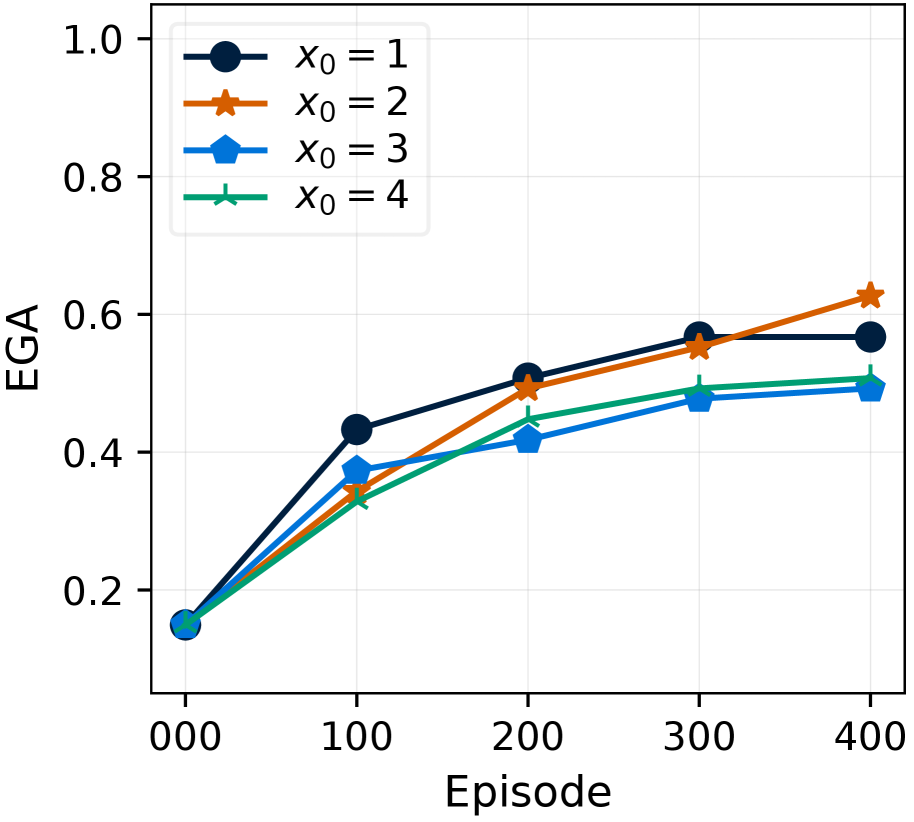
The image is a line chart showing the relationship between EGA (Estimated Goal Achievement) and Episode number for four different initial conditions, denoted as x₀ = 1, x₀ = 2, x₀ = 3, and x₀ = 4. The chart illustrates how EGA changes over episodes for each initial condition.
### Components/Axes
* **X-axis:** Episode, with markers at 0, 100, 200, 300, and 400.
* **Y-axis:** EGA (Estimated Goal Achievement), ranging from 0.0 to 1.0, with markers at 0.2, 0.4, 0.6, 0.8, and 1.0.
* **Legend:** Located in the top-left corner, indicating the initial conditions (x₀) corresponding to each line color:
* Dark Blue: x₀ = 1 (marked with circles)
* Orange: x₀ = 2 (marked with stars)
* Blue: x₀ = 3 (marked with pentagons)
* Green: x₀ = 4 (marked with plus signs)
### Detailed Analysis
* **x₀ = 1 (Dark Blue):** The line starts at approximately 0.15 at Episode 0, increases to approximately 0.43 at Episode 100, reaches approximately 0.51 at Episode 200, rises to approximately 0.57 at Episode 300, and ends at approximately 0.57 at Episode 400. The trend is generally upward, with a plateau towards the end.
* **x₀ = 2 (Orange):** The line starts at approximately 0.15 at Episode 0, increases to approximately 0.37 at Episode 100, reaches approximately 0.51 at Episode 200, rises to approximately 0.57 at Episode 300, and ends at approximately 0.62 at Episode 400. The trend is generally upward.
* **x₀ = 3 (Blue):** The line starts at approximately 0.15 at Episode 0, increases to approximately 0.35 at Episode 100, reaches approximately 0.42 at Episode 200, rises to approximately 0.48 at Episode 300, and ends at approximately 0.50 at Episode 400. The trend is generally upward, but with a less steep slope than x₀ = 1 and x₀ = 2.
* **x₀ = 4 (Green):** The line starts at approximately 0.15 at Episode 0, increases to approximately 0.37 at Episode 100, reaches approximately 0.48 at Episode 200, rises to approximately 0.50 at Episode 300, and ends at approximately 0.51 at Episode 400. The trend is generally upward, similar to x₀ = 3.
### Key Observations
* All lines start at the same EGA value (approximately 0.15) at Episode 0.
* The EGA values for x₀ = 1 and x₀ = 2 are generally higher than those for x₀ = 3 and x₀ = 4 across all episodes.
* The lines for x₀ = 3 and x₀ = 4 are very close to each other, suggesting similar performance.
* The rate of increase in EGA decreases as the number of episodes increases for all initial conditions.
### Interpretation
The chart suggests that the initial conditions (x₀) have an impact on the Estimated Goal Achievement (EGA). Specifically, x₀ = 1 and x₀ = 2 lead to higher EGA values compared to x₀ = 3 and x₀ = 4. The convergence of the lines towards the end of the episode range indicates that the impact of the initial conditions diminishes over time, and the system's performance stabilizes. The diminishing rate of increase in EGA suggests that there are diminishing returns to training as the number of episodes increases.