## Line Graph: EGA Trends Across Episodes for Different X0 Values
### Overview
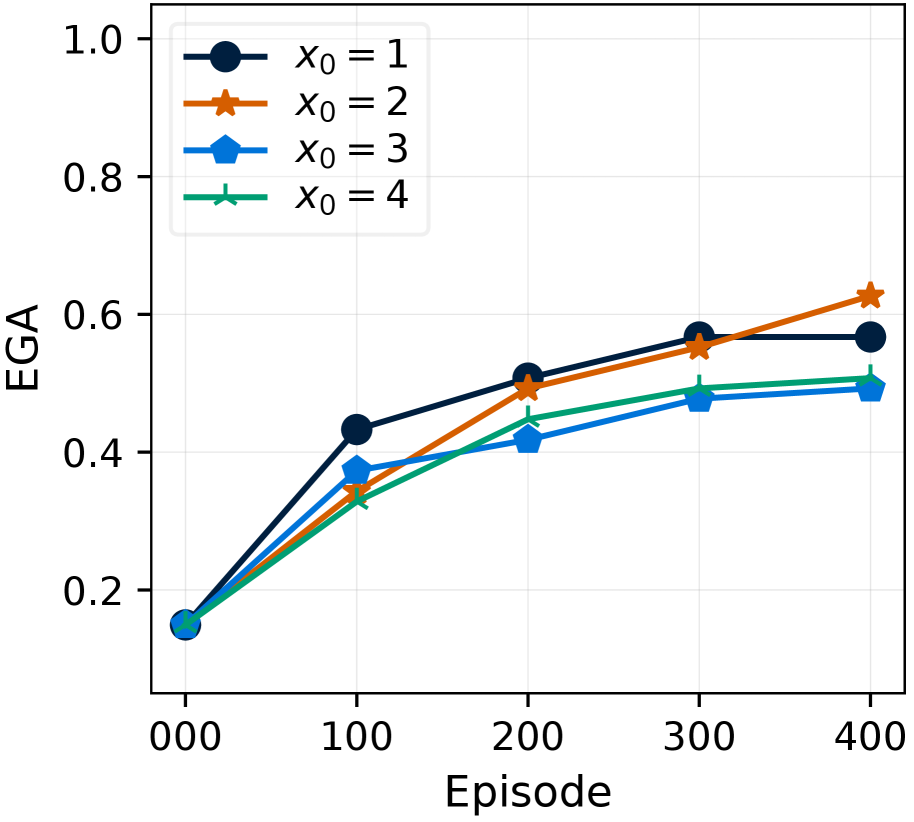
The image is a line graph depicting the evolution of EGA (Expected Gain Accuracy) across episodes for four distinct initial conditions (X₀ = 1, 2, 3, 4). The graph shows four data series, each represented by a unique color and marker, plotted against an episode count (0–400) on the x-axis and EGA values (0–1.0) on the y-axis. The legend is positioned in the top-left corner, and all lines originate from the same baseline at episode 0.
---
### Components/Axes
- **X-axis (Episode)**: Labeled "Episode," with a linear scale from 0 to 400 in increments of 100.
- **Y-axis (EGA)**: Labeled "EGA," with a linear scale from 0.0 to 1.0 in increments of 0.2.
- **Legend**: Located in the top-left corner, with four entries:
- **X₀ = 1**: Black circle (●)
- **X₀ = 2**: Orange star (★)
- **X₀ = 3**: Blue diamond (◆)
- **X₀ = 4**: Green cross (✖️)
- **Data Series**: Four lines, each corresponding to a unique X₀ value, with markers at specific episode intervals (0, 100, 200, 300, 400).
---
### Detailed Analysis
#### X₀ = 1 (Black Circle)
- **Trend**: Sharp initial increase from 0.15 (episode 0) to 0.42 (episode 100), followed by a gradual rise to 0.58 (episode 300) and a plateau at 0.58 (episode 400).
- **Key Points**:
- Episode 0: 0.15
- Episode 100: 0.42
- Episode 200: 0.50
- Episode 300: 0.58
- Episode 400: 0.58
#### X₀ = 2 (Orange Star)
- **Trend**: Steady upward trajectory from 0.15 (episode 0) to 0.63 (episode 400), with consistent growth across all intervals.
- **Key Points**:
- Episode 0: 0.15
- Episode 100: 0.35
- Episode 200: 0.48
- Episode 300: 0.55
- Episode 400: 0.63
#### X₀ = 3 (Blue Diamond)
- **Trend**: Moderate increase from 0.15 (episode 0) to 0.50 (episode 400), with slower growth compared to X₀ = 1 and 2.
- **Key Points**:
- Episode 0: 0.15
- Episode 100: 0.38
- Episode 200: 0.42
- Episode 300: 0.48
- Episode 400: 0.50
#### X₀ = 4 (Green Cross)
- **Trend**: Gradual rise from 0.15 (episode 0) to 0.52 (episode 400), with the slowest growth among all series.
- **Key Points**:
- Episode 0: 0.15
- Episode 100: 0.33
- Episode 200: 0.45
- Episode 300: 0.50
- Episode 400: 0.52
---
### Key Observations
1. **Initial Convergence**: All lines start at the same EGA value (0.15) at episode 0, suggesting identical initial conditions or baseline performance.
2. **Divergence**: By episode 100, the lines begin to diverge, with X₀ = 1 and 2 showing the most significant growth.
3. **Plateauing**: X₀ = 1 and 2 exhibit diminishing returns after episode 300, while X₀ = 3 and 4 continue to rise but at a reduced rate.
4. **Final Values**: At episode 400, X₀ = 2 achieves the highest EGA (0.63), followed by X₀ = 1 (0.58), X₀ = 4 (0.52), and X₀ = 3 (0.50).
---
### Interpretation
The data suggests that higher X₀ values (e.g., X₀ = 2) are associated with greater EGA gains over time, though the rate of improvement varies. The sharp initial rise for X₀ = 1 may indicate a rapid adaptation phase, while the plateauing trend for X₀ = 1 and 2 could reflect stabilization or saturation of performance. The slower growth for X₀ = 3 and 4 might imply suboptimal initial conditions or constraints in their learning dynamics. The convergence at episode 0 and divergence later highlight the importance of initial parameters in determining long-term outcomes. This pattern could be critical for optimizing strategies in systems where EGA is a key metric, such as reinforcement learning or adaptive algorithms.