\n
## Line Chart: Reward Model Accuracy vs. Accuracy Change
### Overview
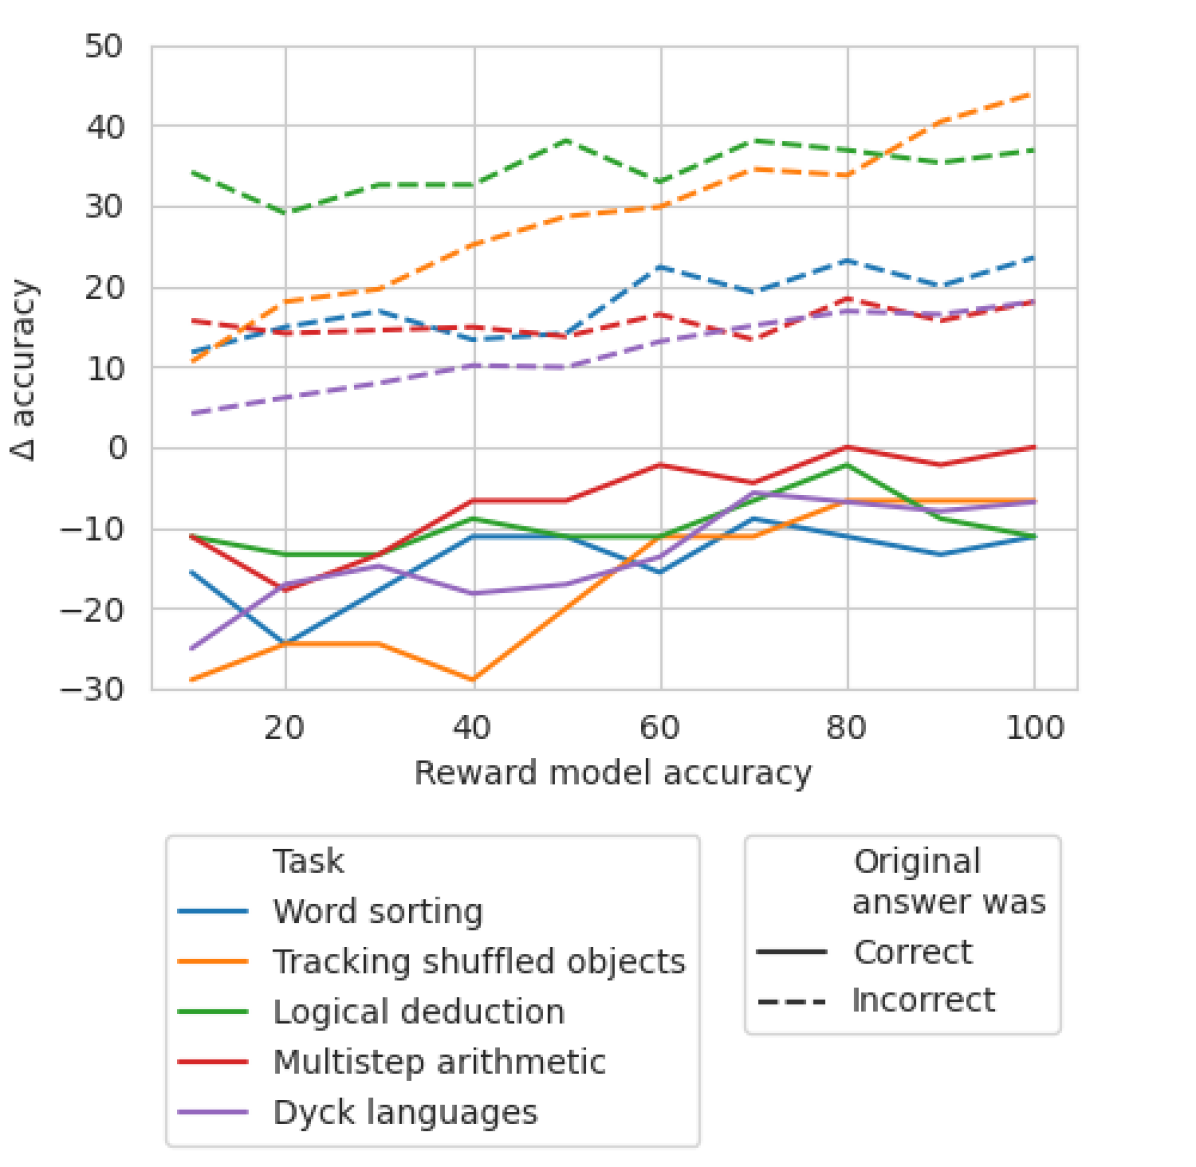
This line chart depicts the relationship between Reward Model Accuracy (x-axis) and the change in accuracy (Δ accuracy, y-axis) for five different tasks. The chart displays how accuracy changes as the reward model's accuracy increases. Different line styles and colors represent different tasks and whether the original answer was correct or incorrect.
### Components/Axes
* **X-axis:** Reward Model Accuracy, ranging from approximately 0 to 100, with markers at 20, 40, 60, 80, and 100.
* **Y-axis:** Δ accuracy, ranging from approximately -30 to 50, with markers at -20, -10, 0, 10, 20, 30, 40.
* **Legend:** Located at the bottom-left of the chart, divided into two sections: "Task" and "Original answer was".
* **Task:**
* Word sorting (blue line)
* Tracking shuffled objects (orange line)
* Logical deduction (green line)
* Multistep arithmetic (red line)
* Dyck languages (purple line)
* **Original answer was:**
* Correct (black solid line)
* Incorrect (black dashed line)
### Detailed Analysis
The chart shows five lines representing the five tasks. Each task has a line for correct answers and a line for incorrect answers.
* **Word sorting (blue):** The line for correct answers slopes upward, starting at approximately 10 at Reward Model Accuracy of 0 and reaching approximately 20 at Reward Model Accuracy of 100. The line for incorrect answers starts at approximately -20 at Reward Model Accuracy of 0 and rises to approximately 10 at Reward Model Accuracy of 100.
* **Tracking shuffled objects (orange):** The line for correct answers starts at approximately 30 at Reward Model Accuracy of 0 and fluctuates around 30-35, reaching approximately 40 at Reward Model Accuracy of 100. The line for incorrect answers starts at approximately -10 at Reward Model Accuracy of 0 and rises to approximately 0 at Reward Model Accuracy of 100.
* **Logical deduction (green):** The line for correct answers starts at approximately 10 at Reward Model Accuracy of 0 and decreases to approximately -10 at Reward Model Accuracy of 100. The line for incorrect answers starts at approximately -20 at Reward Model Accuracy of 0 and rises to approximately 0 at Reward Model Accuracy of 100.
* **Multistep arithmetic (red):** The line for correct answers starts at approximately 0 at Reward Model Accuracy of 0 and fluctuates around 0-10, reaching approximately 10 at Reward Model Accuracy of 100. The line for incorrect answers starts at approximately 10 at Reward Model Accuracy of 0 and decreases to approximately 0 at Reward Model Accuracy of 100.
* **Dyck languages (purple):** The line for correct answers starts at approximately -20 at Reward Model Accuracy of 0 and rises to approximately 10 at Reward Model Accuracy of 100. The line for incorrect answers starts at approximately 10 at Reward Model Accuracy of 0 and decreases to approximately 0 at Reward Model Accuracy of 100.
### Key Observations
* For most tasks, the accuracy change is greater for incorrect answers at low Reward Model Accuracy, but the gap narrows as Reward Model Accuracy increases.
* Tracking shuffled objects consistently shows a positive accuracy change for both correct and incorrect answers, and the correct answer line remains significantly higher than the incorrect answer line.
* Logical deduction shows a negative accuracy change for correct answers as Reward Model Accuracy increases, suggesting that a higher reward model accuracy may not always lead to improved performance on this task.
* Word sorting, Multistep arithmetic, and Dyck languages show a positive trend for correct answers and a negative trend for incorrect answers.
### Interpretation
The chart suggests that the relationship between Reward Model Accuracy and accuracy change is task-dependent. For some tasks (e.g., Tracking shuffled objects), increasing Reward Model Accuracy consistently improves performance. However, for other tasks (e.g., Logical deduction), increasing Reward Model Accuracy may not lead to improved performance, and could even decrease accuracy for correct answers. This could indicate that the reward model is not well-aligned with the optimal solution for these tasks, or that the task itself is sensitive to the reward model's biases. The convergence of lines for correct and incorrect answers at higher Reward Model Accuracy suggests that the reward model becomes less discriminatory as its accuracy increases, potentially due to overfitting or a lack of nuanced reward signals. The chart highlights the importance of carefully evaluating the impact of reward model accuracy on task performance and tailoring reward models to specific tasks.