TECHNICAL ASSET FINGERPRINT
20e0d728a6f45d57fd6bea71
Click to view fullscreen
Press ESC or click to close
FOUND IN PAPERS
EXPERT: healer-alpha-free VERSION 1
RUNTIME: free/openrouter/healer-alpha
INTEL_VERIFIED
## Multi-Series Line Chart: Impact of Reward Model Accuracy on Task Performance Change
### Overview
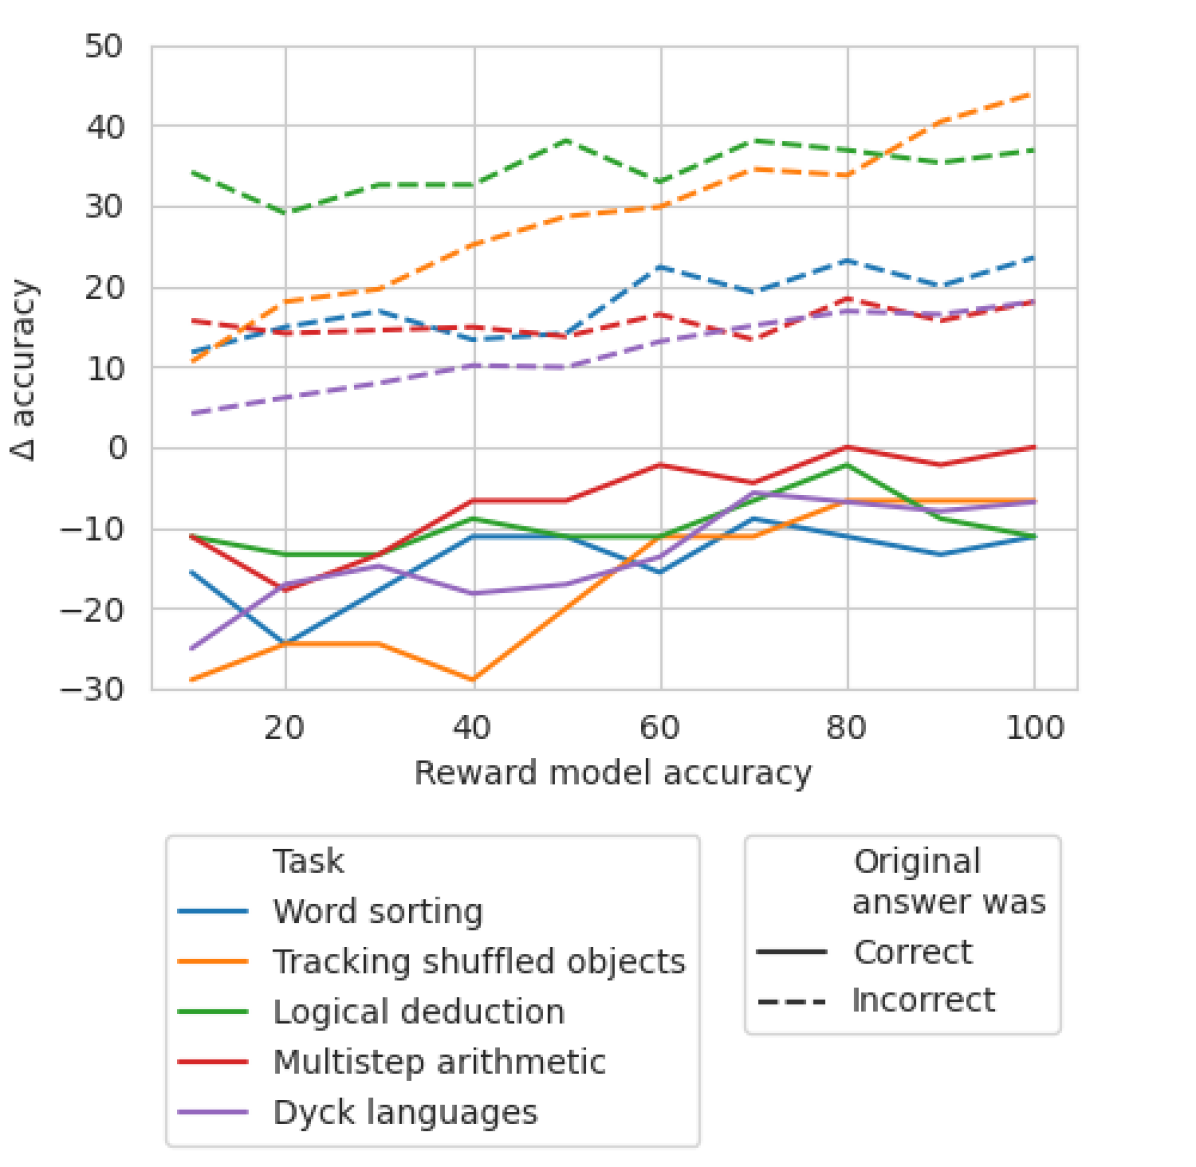
This line chart illustrates the relationship between the accuracy of a reward model (x-axis) and the change in accuracy (Δ accuracy, y-axis) for five distinct reasoning tasks. The data is further segmented by whether the original answer provided by a model was correct or incorrect, represented by solid and dashed lines, respectively. The chart suggests an analysis of how improving a reward model's accuracy affects the subsequent performance of a model on various tasks, depending on its initial correctness.
### Components/Axes
* **X-Axis:** "Reward model accuracy". Scale ranges from 10 to 100, with major gridlines and labels at intervals of 20 (20, 40, 60, 80, 100).
* **Y-Axis:** "Δ accuracy" (Change in accuracy). Scale ranges from -30 to 50, with major gridlines and labels at intervals of 10 (-30, -20, -10, 0, 10, 20, 30, 40, 50).
* **Legend 1 (Bottom-Left):** "Task" with color-coded lines:
* Blue: Word sorting
* Orange: Tracking shuffled objects
* Green: Logical deduction
* Red: Multistep arithmetic
* Purple: Dyck languages
* **Legend 2 (Bottom-Right):** "Original answer was" with line style:
* Solid line (—): Correct
* Dashed line (---): Incorrect
### Detailed Analysis
The chart contains 10 data series (5 tasks × 2 original answer states). Below is an analysis of each, with trends described first, followed by approximate data points extracted at the labeled x-axis intervals (10, 20, 30, 40, 50, 60, 70, 80, 90, 100). Values are approximate.
**1. Word sorting (Blue)**
* **Original Correct (Solid Blue):** Shows a generally negative Δ accuracy, fluctuating between -10 and -25. Trend: Starts low, rises to a peak near x=40, dips, then stabilizes around -10 to -15.
* Points (x, y≈): (10, -15), (20, -24), (30, -18), (40, -11), (50, -10), (60, -15), (70, -9), (80, -11), (90, -13), (100, -11).
* **Original Incorrect (Dashed Blue):** Shows a positive Δ accuracy, generally increasing. Trend: Starts around +12, rises with some fluctuation to a peak near x=80, then slightly declines.
* Points (x, y≈): (10, 12), (20, 15), (30, 17), (40, 14), (50, 18), (60, 23), (70, 20), (80, 24), (90, 21), (100, 24).
**2. Tracking shuffled objects (Orange)**
* **Original Correct (Solid Orange):** Shows a strong positive trend from very negative to near zero. Trend: Starts at the lowest point on the chart, rises steadily, crossing into positive territory after x=70.
* Points (x, y≈): (10, -29), (20, -24), (30, -24), (40, -29), (50, -20), (60, -11), (70, -10), (80, -7), (90, -7), (100, -7).
* **Original Incorrect (Dashed Orange):** Shows a strong, consistent positive trend. Trend: Starts around +11 and climbs steadily to the highest point on the chart.
* Points (x, y≈): (10, 11), (20, 19), (30, 20), (40, 26), (50, 29), (60, 30), (70, 35), (80, 34), (90, 41), (100, 44).
**3. Logical deduction (Green)**
* **Original Correct (Solid Green):** Fluctuates in negative territory. Trend: Starts around -11, dips, rises to a peak near x=80, then falls again.
* Points (x, y≈): (10, -11), (20, -13), (30, -13), (40, -9), (50, -10), (60, -10), (70, -6), (80, -2), (90, -9), (100, -11).
* **Original Incorrect (Dashed Green):** Consistently high positive Δ accuracy, with moderate fluctuation. Trend: Starts high, dips at x=20, peaks at x=50, then remains high.
* Points (x, y≈): (10, 35), (20, 30), (30, 33), (40, 33), (50, 39), (60, 34), (70, 39), (80, 37), (90, 36), (100, 37).
**4. Multistep arithmetic (Red)**
* **Original Correct (Solid Red):** Fluctuates near zero, with a slight positive trend. Trend: Starts negative, crosses into positive after x=60, peaks at x=80, then stabilizes near zero.
* Points (x, y≈): (10, -11), (20, -18), (30, -15), (40, -7), (50, -7), (60, -2), (70, -4), (80, 0), (90, -2), (100, 0).
* **Original Incorrect (Dashed Red):** Shows a stable, slightly positive Δ accuracy. Trend: Hovers between +14 and +19 with minor fluctuations.
* Points (x, y≈): (10, 16), (20, 15), (30, 15), (40, 15), (50, 14), (60, 17), (70, 14), (80, 19), (90, 16), (100, 19).
**5. Dyck languages (Purple)**
* **Original Correct (Solid Purple):** Fluctuates in negative territory. Trend: Starts very low, rises to a peak near x=70, then declines.
* Points (x, y≈): (10, -25), (20, -18), (30, -15), (40, -18), (50, -17), (60, -11), (70, -6), (80, -7), (90, -7), (100, -7).
* **Original Incorrect (Dashed Purple):** Shows a steady, moderate positive trend. Trend: Starts low and climbs consistently.
* Points (x, y≈): (10, 5), (20, 7), (30, 8), (40, 11), (50, 11), (60, 14), (70, 16), (80, 18), (90, 17), (100, 19).
### Key Observations
1. **Systematic Split by Original Correctness:** There is a clear and consistent separation between the two line styles. All dashed lines (Original answer was Incorrect) show a **positive Δ accuracy**, meaning performance improved after reward model training. All solid lines (Original answer was Correct) show a **negative or near-zero Δ accuracy**, meaning performance often decreased or stayed the same.
2. **Task-Dependent Magnitude:** The magnitude of change varies significantly by task. "Tracking shuffled objects" (Orange) and "Logical deduction" (Green) show the largest positive gains when the original answer was incorrect. "Word sorting" (Blue) and "Dyck languages" (Purple) show the largest negative impacts when the original answer was correct.
3. **Trend with Reward Model Accuracy:** For the "Incorrect" original answers (dashed lines), Δ accuracy generally trends upward as reward model accuracy increases, suggesting a stronger reward model provides greater benefit for correcting wrong answers. This trend is most pronounced for "Tracking shuffled objects."
4. **Convergence at High Accuracy:** For several tasks with correct original answers (e.g., Multistep arithmetic - Red, Tracking shuffled objects - Orange), the negative Δ accuracy diminishes and approaches zero as reward model accuracy reaches 80-100, suggesting less harm to already-correct responses from a very accurate reward model.
### Interpretation
This chart demonstrates a critical nuance in reinforcement learning from human feedback (RLHF) or similar reward-model-based training. The data suggests that **improving a reward model's accuracy primarily benefits the correction of initially incorrect model outputs, while potentially degrading the performance on initially correct outputs.**
The "Δ accuracy" likely measures the change in a model's performance on these reasoning tasks after being fine-tuned or aligned using the reward model. The stark dichotomy between solid and dashed lines implies a trade-off: the training process guided by the reward model is effective at steering the model away from its original mistakes (positive Δ for dashed lines) but may cause it to "unlearn" or interfere with its original correct reasoning pathways (negative Δ for solid lines).
The task-dependent variation is insightful. Tasks requiring sequential state tracking ("Tracking shuffled objects") or formal rule application ("Logical deduction," "Dyck languages") show high sensitivity. This could indicate that the reward model's signal is particularly impactful (for better or worse) on tasks where the reasoning process is more structured and potentially easier to reward or punish with a scalar signal.
From a Peircean investigative perspective, the chart is an indexical sign pointing to a causal relationship: the accuracy of the reward model (cause) correlates with a specific, bifurcated effect on downstream task performance (effect), conditioned on the model's prior state. The iconical resemblance of the diverging line families visually represents this fundamental trade-off in alignment techniques. The key takeaway for a practitioner is that optimizing a reward model for overall accuracy may not be sufficient; its behavior must be understood in terms of its impact on both the correction of errors and the preservation of existing competencies.
DECODING INTELLIGENCE...