## Scatter Plot: high_school_us_history
### Overview
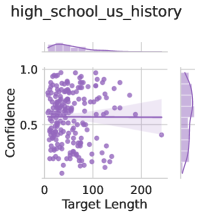
The image is a scatter plot titled "high_school_us_history". It displays the relationship between "Target Length" on the x-axis and "Confidence" on the y-axis. The plot includes marginal density plots along both axes and a regression line with a confidence interval.
### Components/Axes
* **Title:** high\_school\_us\_history
* **X-axis:**
* Label: Target Length
* Scale: 0 to approximately 220
* **Y-axis:**
* Label: Confidence
* Scale: 0 to 1.0
* **Data Points:**
* Color: Purple
* **Marginal Density Plots:**
* Located along the top (Target Length) and right side (Confidence) of the scatter plot.
* Color: Purple
* **Regression Line:**
* Color: Purple
* Confidence Interval: Shaded area around the regression line, also in purple.
### Detailed Analysis
* **Target Length:** The x-axis ranges from 0 to approximately 220.
* **Confidence:** The y-axis ranges from 0 to 1.0.
* **Data Point Distribution:** The data points are scattered across the plot. Most points are concentrated between Target Length values of 0 and 100, with Confidence values ranging from approximately 0.2 to 1.0. There are fewer data points with Target Length values greater than 100.
* **Regression Line:** The regression line is nearly horizontal, indicating a weak or non-existent correlation between Target Length and Confidence.
* **Marginal Density Plots:**
* The density plot for Target Length shows a peak around 0-50, indicating that most data points have a Target Length in this range.
* The density plot for Confidence shows a distribution with a peak around 0.6-0.8, indicating that most data points have a Confidence value in this range.
### Key Observations
* The scatter plot shows a weak or non-existent correlation between Target Length and Confidence.
* Most data points have a Target Length between 0 and 100.
* Most data points have a Confidence value between 0.6 and 0.8.
### Interpretation
The scatter plot suggests that there is no strong relationship between the target length and the confidence level in the "high_school_us_history" dataset. The data points are widely scattered, and the regression line is nearly flat. This indicates that the length of the target does not significantly influence the confidence level. The marginal density plots show that shorter target lengths are more common and that confidence levels tend to be concentrated in the 0.6 to 0.8 range.