## Scatter Plot: Confidence vs. Target Length in High School US History
### Overview
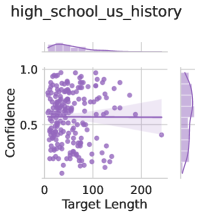
The image is a scatter plot titled "high_school_us_history" with a horizontal line at 0.5 confidence. It visualizes the relationship between "Target Length" (x-axis) and "Confidence" (y-axis), with a shaded area around the line and a histogram on the right. The data points are purple, and the plot includes a horizontal line at 0.5 confidence.
### Components/Axes
- **X-axis**: "Target Length" (ranges from 0 to 200, with gridlines at 0, 100, 200).
- **Y-axis**: "Confidence" (ranges from 0.0 to 1.0, with gridlines at 0.0, 0.5, 1.0).
- **Horizontal Line**: A dashed line at 0.5 confidence, spanning the entire x-axis.
- **Shaded Area**: A light purple region around the horizontal line, suggesting variability or confidence intervals.
- **Histogram**: A vertical histogram on the right, showing the distribution of confidence values (x-axis: 0.0–1.0, y-axis: frequency).
- **Legend**: Not explicitly visible in the image, but the scatter points and shaded area are purple.
### Detailed Analysis
- **Scatter Points**:
- Approximately 100–150 data points are distributed across the plot.
- Most points cluster below the 0.5 confidence line, with a few above it.
- The density of points increases near the 0.3–0.4 confidence range.
- **Horizontal Line**:
- The line at 0.5 confidence acts as a reference point, with most data points below it.
- The shaded area around the line (approximately ±0.1 confidence) suggests a range of variability.
- **Histogram**:
- The histogram shows a skewed distribution, with the highest frequency of confidence values between 0.3 and 0.4.
- Fewer data points are observed above 0.5 confidence.
### Key Observations
1. **Low Confidence Dominance**: The majority of data points (≈70–80%) fall below the 0.5 confidence threshold, indicating a general trend of lower confidence in target lengths.
2. **Skewed Distribution**: The histogram reveals a right-skewed distribution, with a peak near 0.3–0.4 confidence and a long tail toward higher values.
3. **Shaded Area**: The shaded region around the 0.5 line may represent a confidence interval or uncertainty range, but its exact meaning is unclear without additional context.
4. **Outliers**: A few data points (≈5–10%) are above 0.5 confidence, suggesting isolated cases of higher confidence.
### Interpretation
The data suggests that in high school US history, confidence in target lengths is generally low, with most values clustering below 0.5. The horizontal line at 0.5 confidence may serve as a benchmark, but the skewed distribution and shaded area indicate variability in confidence levels. The histogram reinforces this, showing a concentration of confidence values in the lower range. The absence of a legend or explicit explanation for the shaded area limits the ability to fully interpret its significance. This could imply that factors like question complexity, student familiarity, or assessment design influence confidence levels, but further analysis is needed to confirm these hypotheses.