## Dual-Axis Bar and Line Chart: Throughput vs. Accuracy for Top-K Values
### Overview
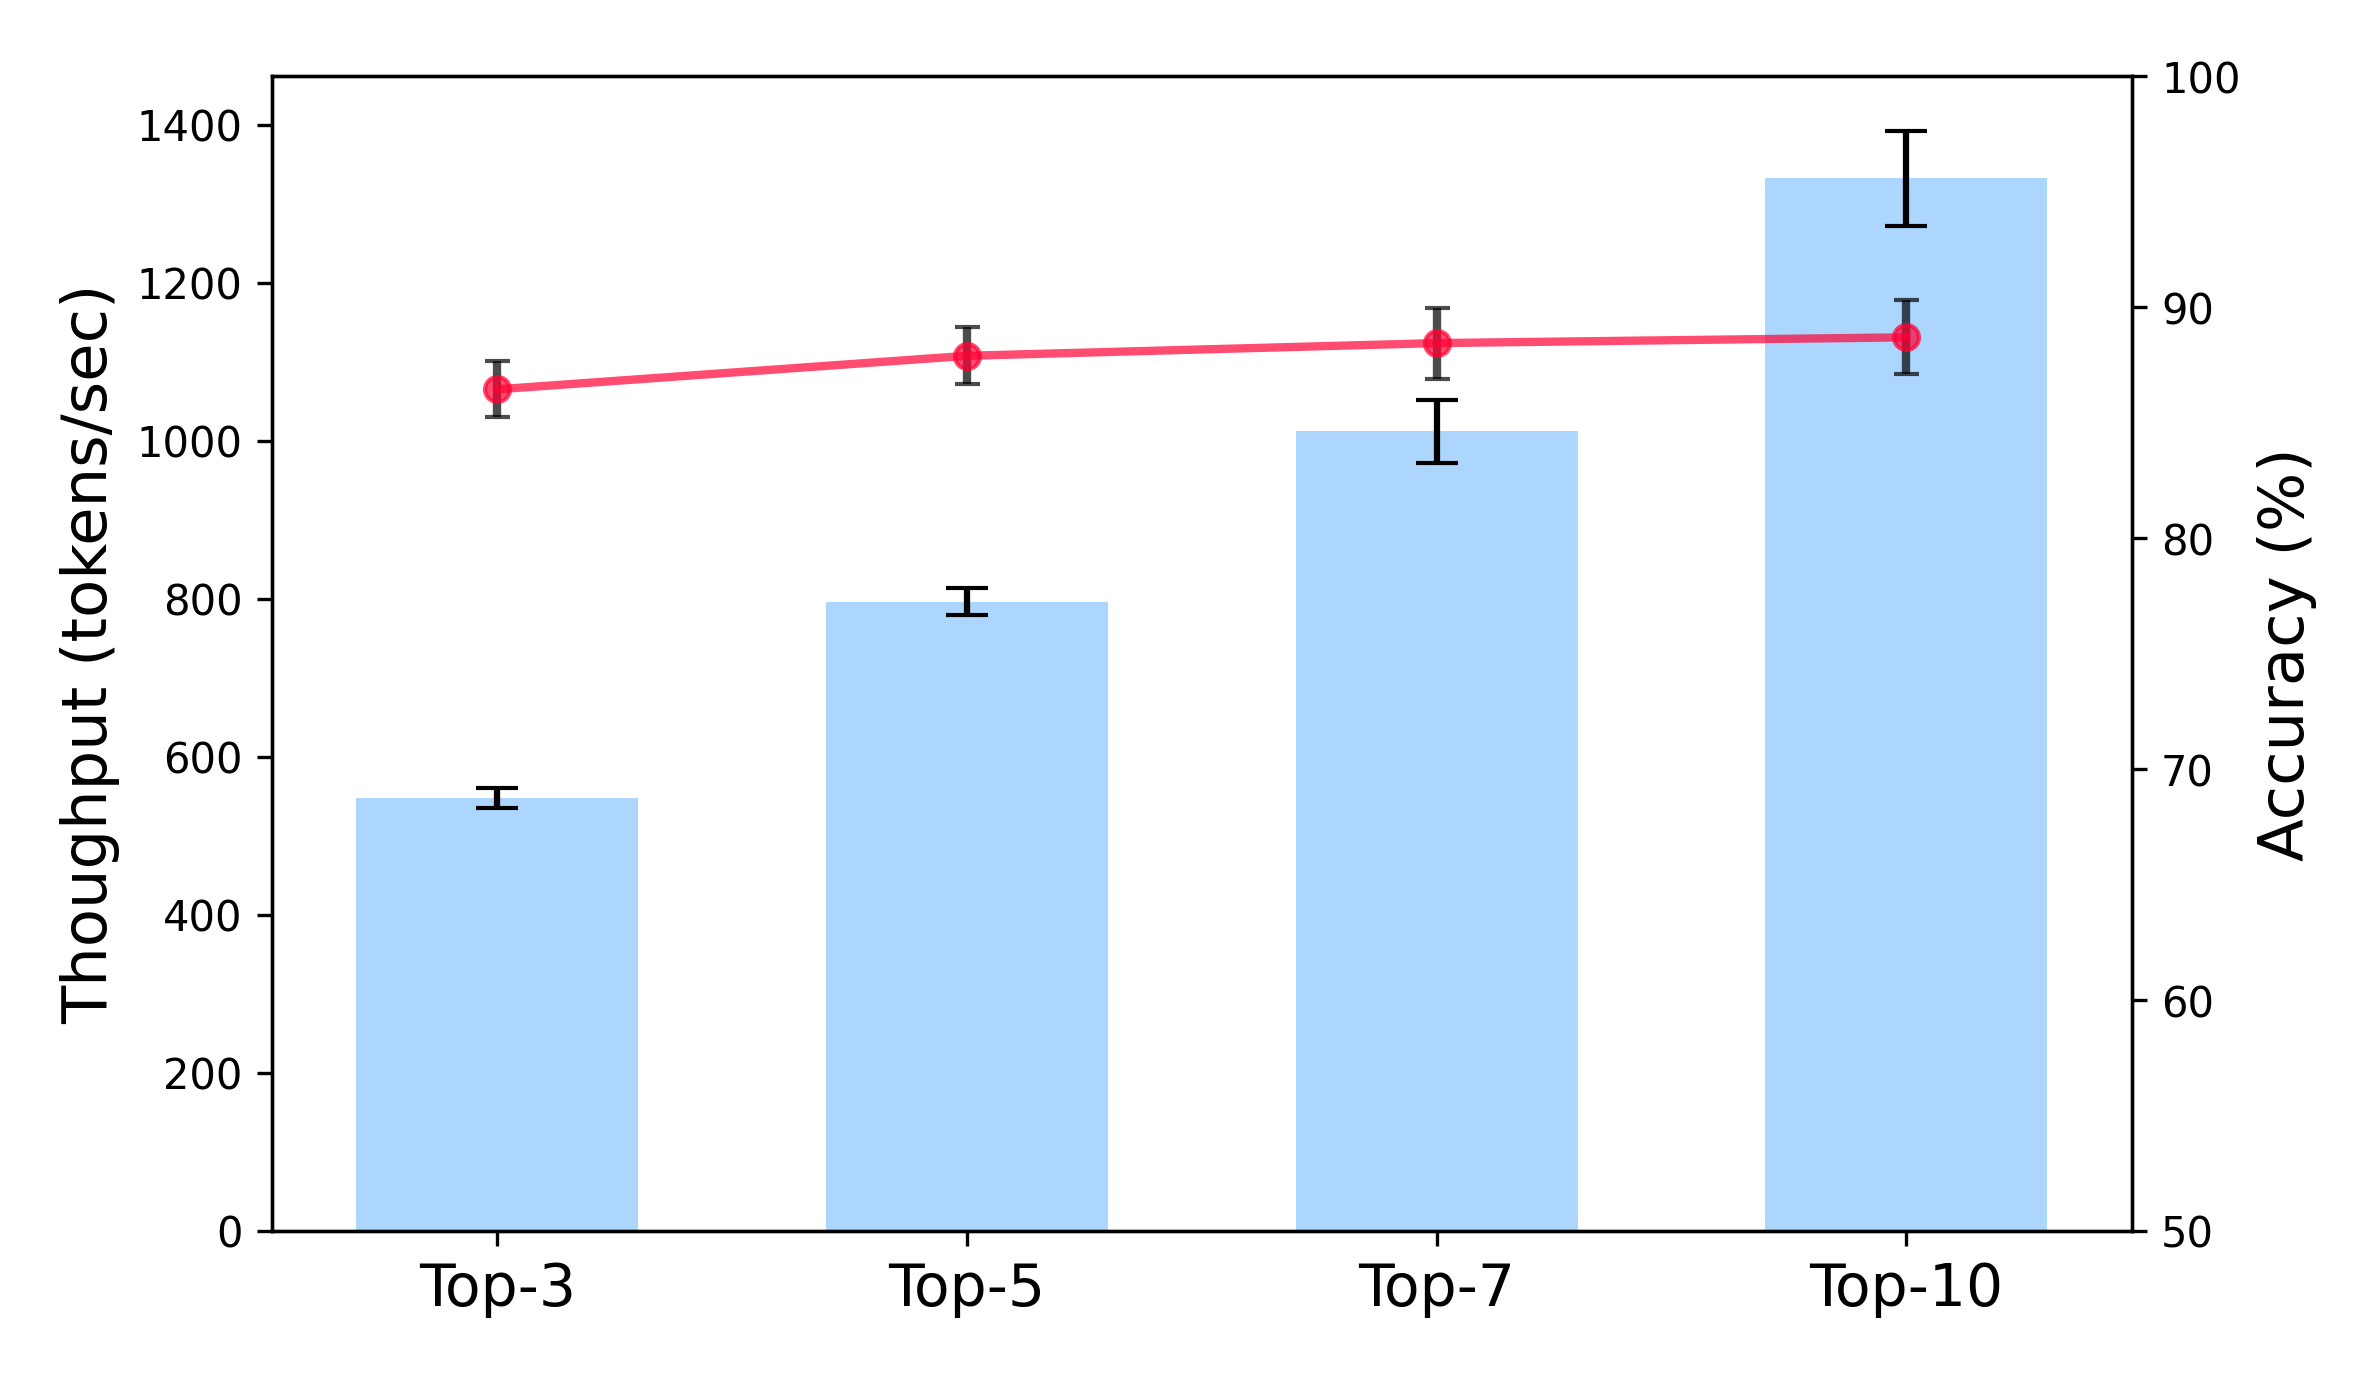
The image is a dual-axis chart comparing the throughput (tokens/sec) and accuracy (%) for different "Top-K" values (Top-3, Top-5, Top-7, Top-10). Throughput is represented by light blue bars, while accuracy is represented by a red line. Error bars are present on both the bars and the line.
### Components/Axes
* **X-axis:** Categorical, labeled "Top-3", "Top-5", "Top-7", and "Top-10".
* **Left Y-axis:** Numerical, labeled "Throughput (tokens/sec)". Scale ranges from 0 to 1400, with increments of 200.
* **Right Y-axis:** Numerical, labeled "Accuracy (%)". Scale ranges from 50 to 100, with increments of 10.
* **Data Series 1:** Throughput (tokens/sec), represented by light blue bars with black error bars.
* **Data Series 2:** Accuracy (%), represented by a red line with black error bars.
### Detailed Analysis
**Throughput (tokens/sec) - Light Blue Bars:**
* **Top-3:** Approximately 550 tokens/sec. Error bars extend roughly +/- 25 tokens/sec.
* **Top-5:** Approximately 800 tokens/sec. Error bars extend roughly +/- 25 tokens/sec.
* **Top-7:** Approximately 1025 tokens/sec. Error bars extend roughly +/- 75 tokens/sec.
* **Top-10:** Approximately 1325 tokens/sec. Error bars extend roughly +/- 75 tokens/sec.
The throughput shows a clear upward trend as the "Top-K" value increases.
**Accuracy (%) - Red Line:**
* **Top-3:** Approximately 87%. Error bars extend roughly +/- 1%.
* **Top-5:** Approximately 88%. Error bars extend roughly +/- 1%.
* **Top-7:** Approximately 89%. Error bars extend roughly +/- 1%.
* **Top-10:** Approximately 89%. Error bars extend roughly +/- 1%.
The accuracy shows a slight upward trend, but it plateaus after Top-7.
### Key Observations
* Throughput increases significantly as the "Top-K" value increases.
* Accuracy increases slightly, but the increase is much less pronounced than the increase in throughput.
* The error bars for throughput are larger for Top-7 and Top-10 compared to Top-3 and Top-5.
* The error bars for accuracy are relatively consistent across all "Top-K" values.
### Interpretation
The chart suggests that increasing the "Top-K" value leads to a substantial increase in throughput, but only a marginal increase in accuracy. This implies a trade-off: by considering more potential options ("Top-K"), the system can process more tokens per second, but the improvement in accuracy diminishes as K increases. The larger error bars for throughput at higher "Top-K" values might indicate increased variability or instability in the system's performance under those conditions. The plateau in accuracy suggests that there is a point of diminishing returns in increasing "Top-K" beyond a certain value (around Top-7 in this case).