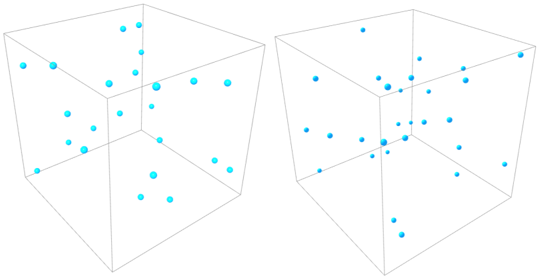
## 3DCube Diagram: Comparative Distribution of Points
### Overview
The image displays two identical 3D transparent cubes positioned side-by-side. Each cube contains scattered blue spherical points distributed across its interior and surfaces. No textual labels, legends, or axis markers are visible.
### Components/Axes
- **Cubes**: Two identical 3D geometric structures with transparent walls, allowing visibility of internal points.
- **Points**: Blue spherical markers distributed unevenly within each cube.
- **Perspective**: Cubes are rendered in isometric projection, with edges converging toward the center of the image.
### Detailed Analysis
- **Left Cube**:
- Contains **15 blue points** (approximate count).
- Points are distributed across all faces, edges, and interior.
- No discernible clustering; points appear randomly placed.
- **Right Cube**:
- Contains **12 blue points** (approximate count).
- Points are more densely clustered toward the center of the cube.
- Fewer points on outer surfaces compared to the left cube.
### Key Observations
1. **Quantity Difference**: The left cube has 3 more points than the right cube.
2. **Distribution Pattern**:
- Left cube: Uniform dispersion.
- Right cube: Central concentration with fewer peripheral points.
3. **Visual Symmetry**: Cubes share identical structural dimensions but differ in point distribution.
### Interpretation
The image likely represents a comparative analysis of two scenarios:
- **Left Cube**: A baseline or control condition with evenly distributed data points.
- **Right Cube**: A modified condition where points cluster centrally, suggesting a concentration effect (e.g., gravitational pull, data aggregation).
The absence of labels or legends limits quantitative interpretation, but the visual contrast implies a focus on spatial distribution dynamics. The central clustering in the right cube could indicate a phenomenon such as attraction, aggregation, or a shift in equilibrium.
**Note**: No textual or numerical data is present in the image. All observations are derived from spatial and quantitative analysis of the visual elements.