# Technical Document Extraction: Control Value Over Time
## Chart Overview
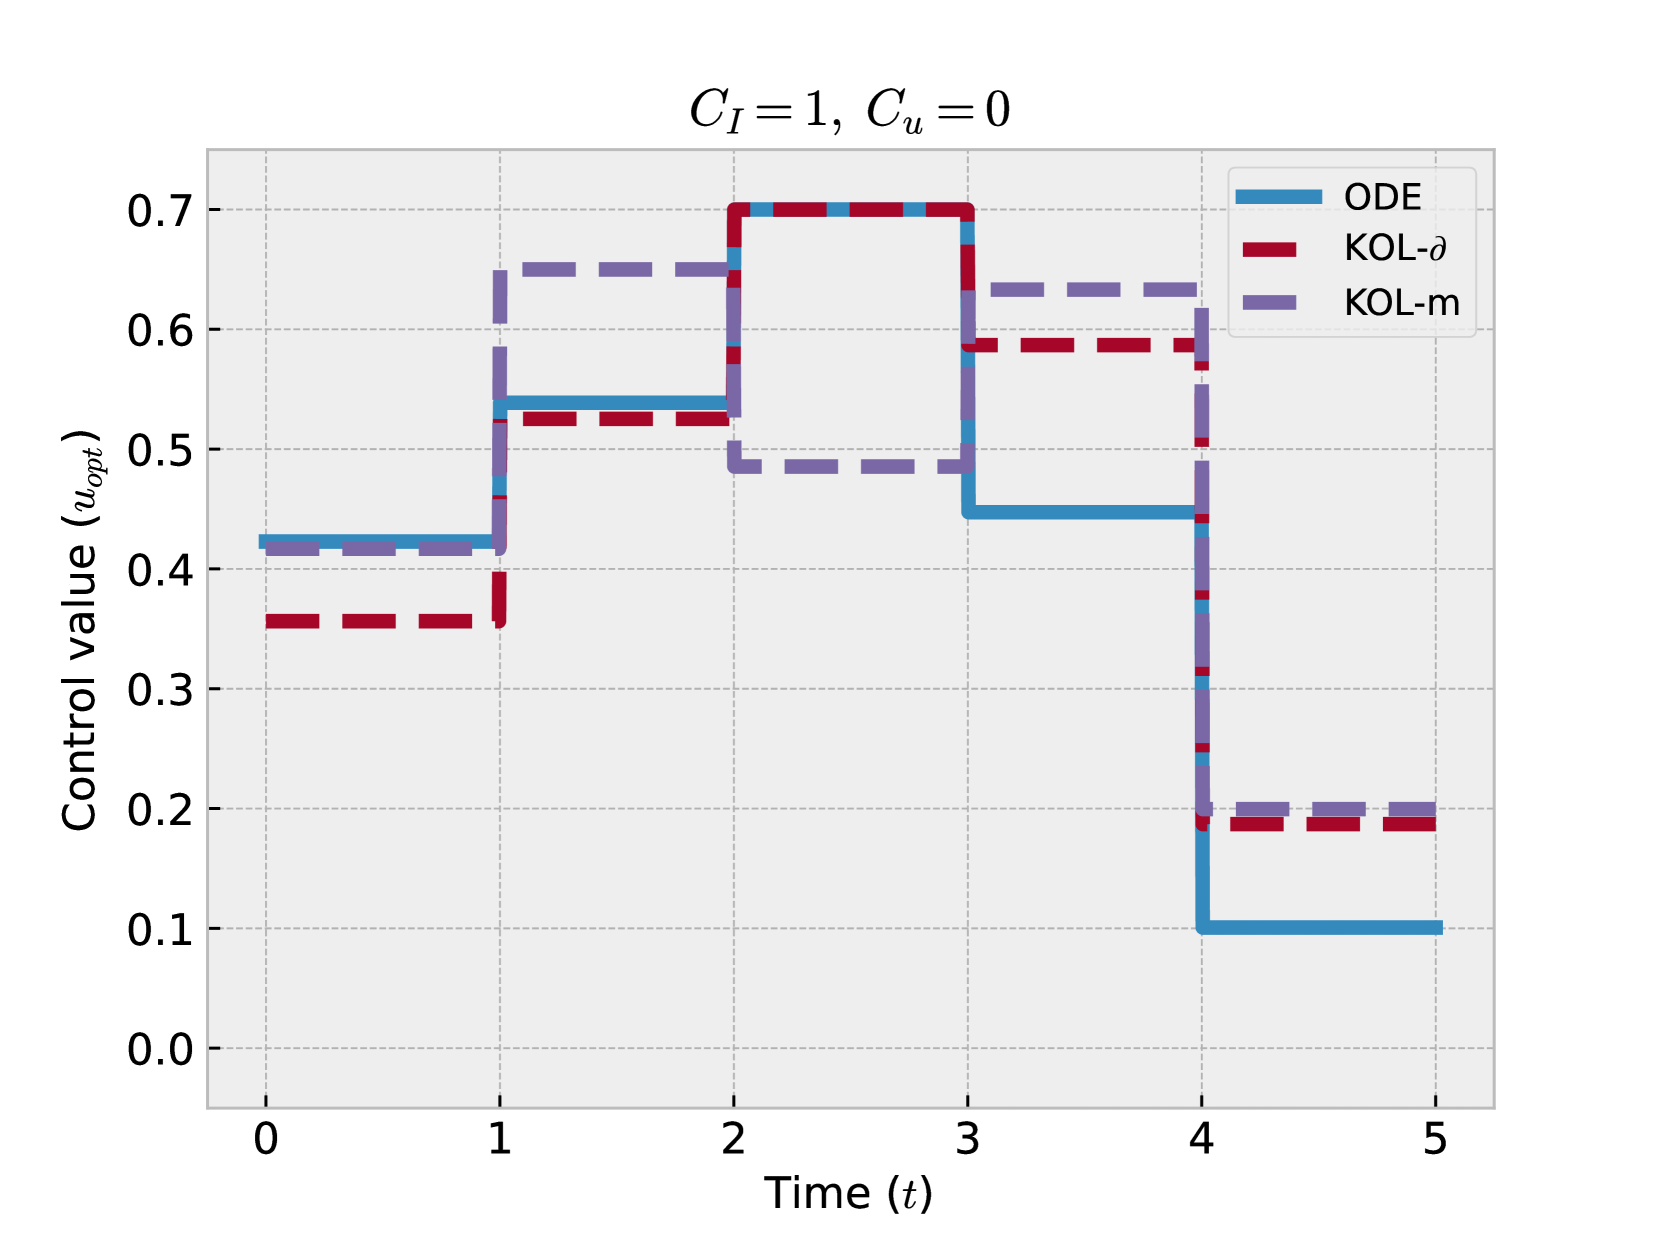
This line chart illustrates the control value (`u_opt`) over time (`t`) for three control strategies: **ODE**, **KOL-δ**, and **KOL-m**. The chart is titled **"C_I = 1, C_u = 0"**, indicating fixed parameters for the system.
---
### Axis Labels and Markers
- **X-axis (Time, t):**
- Range: 0 to 5 (discrete intervals).
- Labels: 0, 1, 2, 3, 4, 5.
- **Y-axis (Control Value, u_opt):**
- Range: 0.0 to 0.7.
- Labels: 0.0, 0.1, 0.2, 0.3, 0.4, 0.5, 0.6, 0.7.
---
### Legend
- **Location:** Top-right corner of the chart.
- **Entries:**
- **Blue (solid):** ODE
- **Red (dashed):** KOL-δ
- **Purple (dash-dot):** KOL-m
---
### Data Series Analysis
#### 1. ODE (Blue Solid Line)
- **Trend:**
- Starts at 0.42 (t=0).
- Increases stepwise to 0.52 (t=1), 0.62 (t=2).
- Drops to 0.42 (t=3), peaks at 0.72 (t=4), then sharply declines to 0.12 (t=5).
- **Key Data Points:**
- t=0: 0.42
- t=1: 0.52
- t=2: 0.62
- t=3: 0.42
- t=4: 0.72
- t=5: 0.12
#### 2. KOL-δ (Red Dashed Line)
- **Trend:**
- Starts at 0.36 (t=0).
- Rises to 0.56 (t=1), remains constant until t=2.
- Drops to 0.36 (t=3), increases to 0.66 (t=4), then falls to 0.16 (t=5).
- **Key Data Points:**
- t=0: 0.36
- t=1: 0.56
- t=2: 0.56
- t=3: 0.36
- t=4: 0.66
- t=5: 0.16
#### 3. KOL-m (Purple Dash-Dot Line)
- **Trend:**
- Starts at 0.42 (t=0).
- Jumps to 0.62 (t=1), remains constant until t=2.
- Drops to 0.42 (t=3), rises to 0.62 (t=4), then declines to 0.22 (t=5).
- **Key Data Points:**
- t=0: 0.42
- t=1: 0.62
- t=2: 0.62
- t=3: 0.42
- t=4: 0.62
- t=5: 0.22
---
### Cross-Reference Validation
- **Legend Colors vs. Line Colors:**
- ODE (blue) matches the solid blue line.
- KOL-δ (red) matches the dashed red line.
- KOL-m (purple) matches the dash-dot purple line.
- **Spatial Grounding:**
- Legend is positioned in the top-right corner, outside the main chart area.
---
### Summary
The chart demonstrates distinct control value trajectories for the three strategies. **ODE** exhibits the highest variability, with a sharp peak at t=4. **KOL-δ** and **KOL-m** show similar patterns but with lower peak values. All data points align with the legend’s color coding, ensuring consistency.