## Line Charts: Per-Period and Per-Action Regret Across Agents with Varying K Values
### Overview
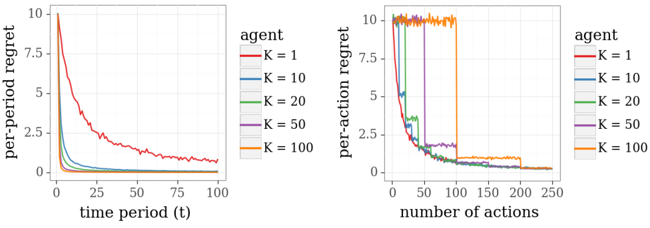
The image contains two side-by-side line charts comparing the performance of agents with different K values (1, 10, 20, 50, 100) in terms of **per-period regret** (left) and **per-action regret** (right). Both charts use color-coded lines to represent agents, with K values increasing from red (K=1) to orange (K=100). The charts illustrate how regret evolves over time (left) and with the number of actions (right).
---
### Components/Axes
#### Left Chart: Per-Period Regret
- **X-axis**: Time period (t), ranging from 0 to 100.
- **Y-axis**: Per-period regret, scaled from 0 to 10.
- **Legend**: Located on the right, mapping colors to K values:
- Red: K = 1
- Blue: K = 10
- Green: K = 20
- Purple: K = 50
- Orange: K = 100
#### Right Chart: Per-Action Regret
- **X-axis**: Number of actions, ranging from 0 to 250.
- **Y-axis**: Per-action regret, scaled from 0 to 10.
- **Legend**: Same as the left chart, with identical color-to-K mappings.
---
### Detailed Analysis
#### Left Chart: Per-Period Regret
- **K = 1 (Red)**: Starts at ~10 regret, drops sharply to ~0.5 by t=100, then plateaus.
- **K = 10 (Blue)**: Begins at ~8 regret, decreases gradually to ~0.2 by t=100.
- **K = 20 (Green)**: Starts at ~6 regret, declines to ~0.1 by t=100.
- **K = 50 (Purple)**: Initial regret ~4, decreases slowly to ~0.05.
- **K = 100 (Orange)**: Starts at ~2 regret, declines to ~0.02 by t=100.
- **Trend**: Higher K values correlate with lower initial regret and slower but steadier declines. K=1 shows the steepest initial drop but higher long-term regret compared to larger K values.
#### Right Chart: Per-Action Regret
- **K = 1 (Red)**: Drops from ~10 to ~0.5 in ~50 actions, then plateaus.
- **K = 10 (Blue)**: Declines from ~8 to ~0.3 in ~100 actions.
- **K = 20 (Green)**: Reduces from ~6 to ~0.1 in ~150 actions.
- **K = 50 (Purple)**: Starts at ~4, decreases to ~0.05 in ~200 actions.
- **K = 100 (Orange)**: Sharpest drop, reaching ~0.02 in ~50 actions, then stabilizes.
- **Trend**: Higher K values achieve lower regret faster. K=100 converges most rapidly, while K=1 requires more actions to stabilize.
---
### Key Observations
1. **Inverse Relationship Between K and Regret**:
- Larger K values (e.g., 100) consistently exhibit lower regret across both metrics.
- K=1 (smallest K) shows the highest regret initially but improves rapidly over time/actions.
2. **Convergence Behavior**:
- In the left chart, regret stabilizes after ~50 time periods for all K values.
- In the right chart, regret plateaus after ~100–200 actions, depending on K.
3. **Anomalies**:
- K=100 (orange) in the right chart drops abruptly, suggesting a threshold effect where increasing K beyond a point yields diminishing returns.
- K=1 (red) in the left chart has a steeper initial decline than K=100, indicating faster adaptation in early time periods.
---
### Interpretation
The data demonstrates that **increasing K reduces regret**, but the rate and magnitude of improvement depend on the context:
- **Time-Based Regret (Left Chart)**: Higher K values (e.g., 100) achieve lower long-term regret, suggesting better stability over time. K=1 adapts quickly initially but underperforms larger K values in the long run.
- **Action-Based Regret (Right Chart)**: Larger K values (e.g., 100) reduce regret more efficiently per action, implying faster convergence. This suggests that K acts as a regularization parameter, balancing exploration (lower K) and exploitation (higher K).
The sharp declines for high K values (e.g., K=100) in the right chart highlight a potential trade-off: while higher K accelerates learning, it may require more computational resources. Conversely, lower K values (e.g., K=1) might be preferable in resource-constrained scenarios despite slower convergence.