## Chart: Auditory Thresholds and Differences
### Overview
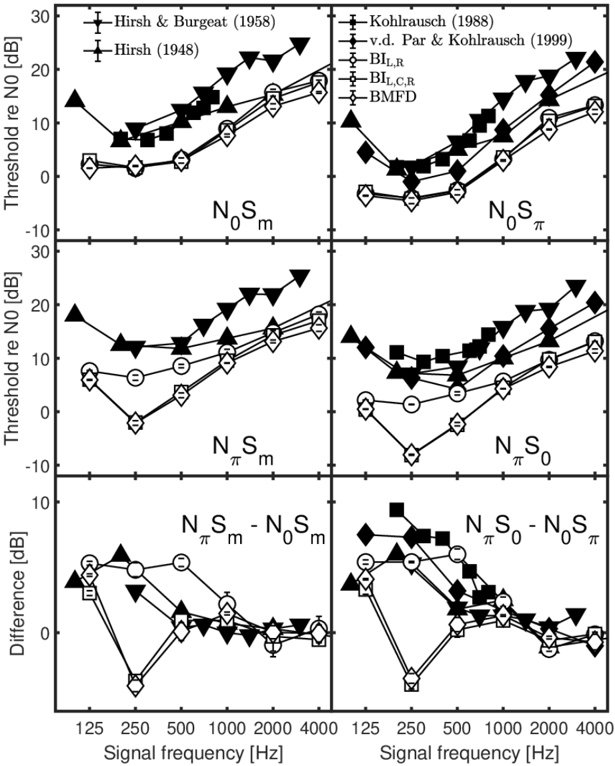
The image presents a series of four line graphs arranged in a 2x2 grid, displaying auditory thresholds and differences in decibels (dB) relative to N0, plotted against signal frequency in Hertz (Hz). Each graph represents a different auditory condition (N0Sm, N0Sπ, NπSm, NπS0) or a difference between conditions. The data is compared across several studies, indicated by different line styles and markers.
### Components/Axes
* **Y-axis (left side):** "Threshold re N0 [dB]" with a scale from -10 to 30 dB, incrementing by 10 dB. The bottom left graph's y-axis is labeled "Difference [dB]" with a scale from -5 to 10 dB, incrementing by 5 dB.
* **X-axis (bottom):** "Signal frequency [Hz]" with values 125, 250, 500, 1000, 2000, and 4000 Hz.
* **Top-Left Graph:** Labeled "N0Sm"
* **Top-Right Graph:** Labeled "N0Sπ"
* **Bottom-Left Graph:** Labeled "NπSm - N0Sm"
* **Bottom-Right Graph:** Labeled "NπS0 - N0Sπ"
* **Legend (top-right):**
* Black line with cross markers: Kohlrausch (1988)
* Black line with horizontal bar markers: v.d. Par & Kohlrausch (1999)
* Black line with diamond markers: BIL,R
* White line with diamond markers: BIL,C,R
* Black line with square markers: BMFD
* **Legend (top-left):**
* Black line with plus markers: Hirsh & Burgeat (1958)
* Black line with triangle markers: Hirsh (1948)
### Detailed Analysis
**Top-Left Graph (N0Sm):**
* **Hirsh & Burgeat (1958):** Starts at approximately 2 dB at 125 Hz, gradually increases to around 4 dB at 4000 Hz.
* **Hirsh (1948):** Starts at approximately 15 dB at 125 Hz, increases to approximately 22 dB at 4000 Hz.
* **Kohlrausch (1988):** Starts at approximately 2 dB at 125 Hz, gradually increases to around 15 dB at 4000 Hz.
* **v.d. Par & Kohlrausch (1999):** Starts at approximately 2 dB at 125 Hz, gradually increases to around 15 dB at 4000 Hz.
* **BIL,R:** Starts at approximately -2 dB at 125 Hz, gradually increases to around 15 dB at 4000 Hz.
* **BIL,C,R:** Starts at approximately -2 dB at 125 Hz, gradually increases to around 15 dB at 4000 Hz.
* **BMFD:** Starts at approximately 0 dB at 125 Hz, gradually increases to around 18 dB at 4000 Hz.
**Top-Right Graph (N0Sπ):**
* **Kohlrausch (1988):** Starts at approximately 0 dB at 125 Hz, decreases to approximately -5 dB at 250 Hz, then increases to approximately 25 dB at 4000 Hz.
* **v.d. Par & Kohlrausch (1999):** Starts at approximately 0 dB at 125 Hz, decreases to approximately -5 dB at 250 Hz, then increases to approximately 15 dB at 4000 Hz.
* **BIL,R:** Starts at approximately -5 dB at 125 Hz, decreases to approximately -8 dB at 250 Hz, then increases to approximately 10 dB at 4000 Hz.
* **BIL,C,R:** Starts at approximately -5 dB at 125 Hz, decreases to approximately -8 dB at 250 Hz, then increases to approximately 10 dB at 4000 Hz.
* **BMFD:** Starts at approximately 0 dB at 125 Hz, decreases to approximately -5 dB at 250 Hz, then increases to approximately 18 dB at 4000 Hz.
* **Hirsh (1948):** Starts at approximately 10 dB at 125 Hz, increases to approximately 25 dB at 4000 Hz.
**Bottom-Left Graph (NπSm - N0Sm):**
* **Hirsh & Burgeat (1958):** Starts at approximately 2 dB at 125 Hz, decreases to approximately 0 dB at 4000 Hz.
* **Hirsh (1948):** Starts at approximately 5 dB at 125 Hz, decreases to approximately 0 dB at 4000 Hz.
* **Kohlrausch (1988):** Starts at approximately 5 dB at 125 Hz, decreases to approximately 0 dB at 4000 Hz.
* **v.d. Par & Kohlrausch (1999):** Starts at approximately 2 dB at 125 Hz, decreases to approximately 0 dB at 4000 Hz.
* **BIL,R:** Starts at approximately 0 dB at 125 Hz, decreases to approximately 0 dB at 4000 Hz.
* **BIL,C,R:** Starts at approximately 0 dB at 125 Hz, decreases to approximately 0 dB at 4000 Hz.
* **BMFD:** Starts at approximately 2 dB at 125 Hz, decreases to approximately 0 dB at 4000 Hz.
**Bottom-Right Graph (NπS0 - N0Sπ):**
* **Kohlrausch (1988):** Starts at approximately 5 dB at 125 Hz, decreases to approximately -2 dB at 250 Hz, then increases to approximately 0 dB at 4000 Hz.
* **v.d. Par & Kohlrausch (1999):** Starts at approximately 2 dB at 125 Hz, decreases to approximately -5 dB at 250 Hz, then increases to approximately 0 dB at 4000 Hz.
* **BIL,R:** Starts at approximately 2 dB at 125 Hz, decreases to approximately -5 dB at 250 Hz, then increases to approximately 0 dB at 4000 Hz.
* **BIL,C,R:** Starts at approximately 2 dB at 125 Hz, decreases to approximately -5 dB at 250 Hz, then increases to approximately 0 dB at 4000 Hz.
* **BMFD:** Starts at approximately 5 dB at 125 Hz, decreases to approximately -2 dB at 250 Hz, then increases to approximately 0 dB at 4000 Hz.
* **Hirsh (1948):** Starts at approximately 2 dB at 125 Hz, decreases to approximately 0 dB at 4000 Hz.
### Key Observations
* Thresholds generally increase with signal frequency for N0Sm and N0Sπ conditions.
* The difference between NπSm and N0Sm, and NπS0 and N0Sπ tends to decrease with increasing frequency, approaching zero.
* There are noticeable differences in thresholds reported by different studies (e.g., Hirsh (1948) vs. other studies).
* The BIL,R and BIL,C,R data are very similar across all conditions.
### Interpretation
The data suggests that auditory thresholds vary depending on the signal frequency and the specific auditory condition (N0Sm, N0Sπ, etc.). The differences between conditions (NπSm - N0Sm, NπS0 - N0Sπ) indicate how the perception of sound changes when the phase or other parameters of the signal are altered. The discrepancies between studies highlight the variability in auditory measurements and potentially differences in methodologies or participant populations. The convergence of the difference curves towards zero at higher frequencies suggests that the effect of the phase manipulation diminishes at higher frequencies.