TECHNICAL ASSET FINGERPRINT
2127c005b7040d36893112d9
Click to view fullscreen
Press ESC or click to close
FOUND IN PAPERS
EXPERT: gemma-3-27b-it-free VERSION 1
RUNTIME: google-free/gemma-3-27b-it
INTEL_VERIFIED
\n
## Line Chart: Thresholds and Differences in Signal Detection
### Overview
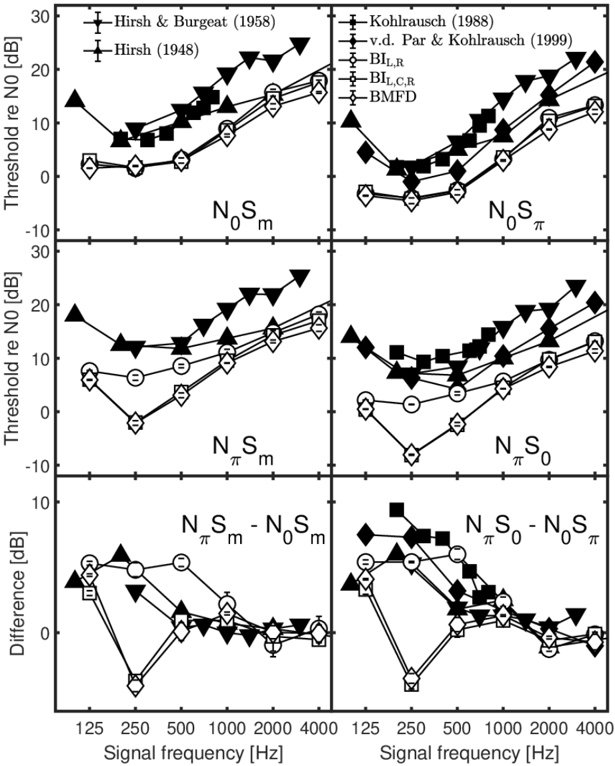
The image presents a series of line charts comparing signal detection thresholds under different noise conditions. There are six charts arranged in a 2x3 grid. The charts plot "Threshold re N0 [dB]" (decibels relative to noise power spectral density) against "Signal frequency [Hz]". The bottom two charts display the difference in thresholds between different noise conditions.
### Components/Axes
* **X-axis:** Signal frequency [Hz], ranging from 125 Hz to 4000 Hz. Marked at 125, 250, 500, 1000, 2000, and 4000 Hz.
* **Y-axis:** Threshold re N0 [dB], ranging from -10 dB to 30 dB. Marked at -10, 0, 10, 20, and 30 dB.
* **Legends:** Each chart has a legend identifying different models/studies.
* **Top Row:**
* Hirsch & Burgeat (1958) - Red
* Hirsch (1948) - Black
* Kohlrausch (1988) - Dark Grey
* v.d. Par & Kohlrausch (1999) - Light Grey
* BIL<sub>R</sub> - Grey with X marker
* BIL<sub>C,R</sub> - Grey with Triangle marker
* BMFD - Grey with Diamond marker
* **Middle Row:** Same as Top Row
* **Bottom Row:** Same as Top Row
* **Titles:** Each chart is labeled with a noise condition:
* N<sub>S0m</sub>
* N<sub>S0π</sub>
* N<sub>Smπ</sub>
* N<sub>Sπ</sub> - N<sub>S0π</sub>
* N<sub>Sπm</sub> - N<sub>S0m</sub>
* N<sub>S0π</sub> - N<sub>S0m</sub>
### Detailed Analysis or Content Details
**Chart 1: N<sub>S0m</sub>**
* Hirsch & Burgeat (1958) (Red): Starts at approximately 18 dB at 125 Hz, rises to approximately 22 dB at 500 Hz, then decreases to approximately 19 dB at 4000 Hz.
* Hirsch (1948) (Black): Starts at approximately 12 dB at 125 Hz, rises to approximately 18 dB at 500 Hz, then decreases to approximately 14 dB at 4000 Hz.
* Kohlrausch (1988) (Dark Grey): Starts at approximately 8 dB at 125 Hz, rises to approximately 14 dB at 500 Hz, then increases to approximately 18 dB at 4000 Hz.
* v.d. Par & Kohlrausch (1999) (Light Grey): Starts at approximately 7 dB at 125 Hz, rises to approximately 12 dB at 500 Hz, then increases to approximately 16 dB at 4000 Hz.
* BIL<sub>R</sub> (Grey with X): Starts at approximately 10 dB at 125 Hz, rises to approximately 16 dB at 500 Hz, then increases to approximately 20 dB at 4000 Hz.
* BIL<sub>C,R</sub> (Grey with Triangle): Starts at approximately 8 dB at 125 Hz, rises to approximately 14 dB at 500 Hz, then increases to approximately 18 dB at 4000 Hz.
* BMFD (Grey with Diamond): Starts at approximately 6 dB at 125 Hz, rises to approximately 10 dB at 500 Hz, then increases to approximately 14 dB at 4000 Hz.
**Chart 2: N<sub>S0π</sub>**
* Hirsch & Burgeat (1958) (Red): Starts at approximately 16 dB at 125 Hz, rises to approximately 20 dB at 500 Hz, then decreases to approximately 17 dB at 4000 Hz.
* Hirsch (1948) (Black): Starts at approximately 10 dB at 125 Hz, rises to approximately 16 dB at 500 Hz, then decreases to approximately 12 dB at 4000 Hz.
* Kohlrausch (1988) (Dark Grey): Starts at approximately 6 dB at 125 Hz, rises to approximately 12 dB at 500 Hz, then increases to approximately 16 dB at 4000 Hz.
* v.d. Par & Kohlrausch (1999) (Light Grey): Starts at approximately 5 dB at 125 Hz, rises to approximately 10 dB at 500 Hz, then increases to approximately 14 dB at 4000 Hz.
* BIL<sub>R</sub> (Grey with X): Starts at approximately 8 dB at 125 Hz, rises to approximately 14 dB at 500 Hz, then increases to approximately 18 dB at 4000 Hz.
* BIL<sub>C,R</sub> (Grey with Triangle): Starts at approximately 6 dB at 125 Hz, rises to approximately 12 dB at 500 Hz, then increases to approximately 16 dB at 4000 Hz.
* BMFD (Grey with Diamond): Starts at approximately 4 dB at 125 Hz, rises to approximately 8 dB at 500 Hz, then increases to approximately 12 dB at 4000 Hz.
**Chart 3: N<sub>Smπ</sub>**
* Hirsch & Burgeat (1958) (Red): Starts at approximately 14 dB at 125 Hz, rises to approximately 18 dB at 500 Hz, then decreases to approximately 15 dB at 4000 Hz.
* Hirsch (1948) (Black): Starts at approximately 8 dB at 125 Hz, rises to approximately 14 dB at 500 Hz, then decreases to approximately 10 dB at 4000 Hz.
* Kohlrausch (1988) (Dark Grey): Starts at approximately 4 dB at 125 Hz, rises to approximately 10 dB at 500 Hz, then increases to approximately 14 dB at 4000 Hz.
* v.d. Par & Kohlrausch (1999) (Light Grey): Starts at approximately 3 dB at 125 Hz, rises to approximately 8 dB at 500 Hz, then increases to approximately 12 dB at 4000 Hz.
* BIL<sub>R</sub> (Grey with X): Starts at approximately 6 dB at 125 Hz, rises to approximately 12 dB at 500 Hz, then increases to approximately 16 dB at 4000 Hz.
* BIL<sub>C,R</sub> (Grey with Triangle): Starts at approximately 4 dB at 125 Hz, rises to approximately 10 dB at 500 Hz, then increases to approximately 14 dB at 4000 Hz.
* BMFD (Grey with Diamond): Starts at approximately 2 dB at 125 Hz, rises to approximately 6 dB at 500 Hz, then increases to approximately 10 dB at 4000 Hz.
**Chart 4: N<sub>Sπ</sub> - N<sub>S0π</sub>**
* Hirsch & Burgeat (1958) (Red): Starts at approximately 2 dB at 125 Hz, remains relatively flat around 2 dB until 2000 Hz, then decreases to approximately 0 dB at 4000 Hz.
* Hirsch (1948) (Black): Starts at approximately 2 dB at 125 Hz, remains relatively flat around 2 dB until 2000 Hz, then decreases to approximately 0 dB at 4000 Hz.
* Kohlrausch (1988) (Dark Grey): Starts at approximately 2 dB at 125 Hz, remains relatively flat around 2 dB until 2000 Hz, then decreases to approximately 0 dB at 4000 Hz.
* v.d. Par & Kohlrausch (1999) (Light Grey): Starts at approximately 2 dB at 125 Hz, remains relatively flat around 2 dB until 2000 Hz, then decreases to approximately 0 dB at 4000 Hz.
* BIL<sub>R</sub> (Grey with X): Starts at approximately 2 dB at 125 Hz, remains relatively flat around 2 dB until 2000 Hz, then decreases to approximately 0 dB at 4000 Hz.
* BIL<sub>C,R</sub> (Grey with Triangle): Starts at approximately 2 dB at 125 Hz, remains relatively flat around 2 dB until 2000 Hz, then decreases to approximately 0 dB at 4000 Hz.
* BMFD (Grey with Diamond): Starts at approximately 2 dB at 125 Hz, remains relatively flat around 2 dB until 2000 Hz, then decreases to approximately 0 dB at 4000 Hz.
**Chart 5: N<sub>Sπm</sub> - N<sub>S0m</sub>**
* Hirsch & Burgeat (1958) (Red): Starts at approximately 4 dB at 125 Hz, remains relatively flat around 4 dB until 2000 Hz, then decreases to approximately 2 dB at 4000 Hz.
* Hirsch (1948) (Black): Starts at approximately 4 dB at 125 Hz, remains relatively flat around 4 dB until 2000 Hz, then decreases to approximately 2 dB at 4000 Hz.
* Kohlrausch (1988) (Dark Grey): Starts at approximately 4 dB at 125 Hz, remains relatively flat around 4 dB until 2000 Hz, then decreases to approximately 2 dB at 4000 Hz.
* v.d. Par & Kohlrausch (1999) (Light Grey): Starts at approximately 4 dB at 125 Hz, remains relatively flat around 4 dB until 2000 Hz, then decreases to approximately 2 dB at 4000 Hz.
* BIL<sub>R</sub> (Grey with X): Starts at approximately 4 dB at 125 Hz, remains relatively flat around 4 dB until 2000 Hz, then decreases to approximately 2 dB at 4000 Hz.
* BIL<sub>C,R</sub> (Grey with Triangle): Starts at approximately 4 dB at 125 Hz, remains relatively flat around 4 dB until 2000 Hz, then decreases to approximately 2 dB at 4000 Hz.
* BMFD (Grey with Diamond): Starts at approximately 4 dB at 125 Hz, remains relatively flat around 4 dB until 2000 Hz, then decreases to approximately 2 dB at 4000 Hz.
**Chart 6: N<sub>S0π</sub> - N<sub>S0m</sub>**
* Hirsch & Burgeat (1958) (Red): Starts at approximately 2 dB at 125 Hz, remains relatively flat around 2 dB until 2000 Hz, then decreases to approximately 2 dB at 4000 Hz.
* Hirsch (1948) (Black): Starts at approximately 2 dB at 125 Hz, remains relatively flat around 2 dB until 2000 Hz, then decreases to approximately 2 dB at 4000 Hz.
* Kohlrausch (1988) (Dark Grey): Starts at approximately 2 dB at 125 Hz, remains relatively flat around 2 dB until 2000 Hz, then decreases to approximately 2 dB at 4000 Hz.
* v.d. Par & Kohlrausch (1999) (Light Grey): Starts at approximately 2 dB at 125 Hz, remains relatively flat around 2 dB until 2000 Hz, then decreases to approximately 2 dB at 4000 Hz.
* BIL<sub>R</sub> (Grey with X): Starts at approximately 2 dB at 125 Hz, remains relatively flat around 2 dB until 2000 Hz, then decreases to approximately 2 dB at 4000 Hz.
* BIL<sub>C,R</sub> (Grey with Triangle): Starts at approximately 2 dB at 125 Hz, remains relatively flat around 2 dB until 2000 Hz, then decreases to approximately 2 dB at 4000 Hz.
* BMFD (Grey with Diamond): Starts at approximately 2 dB at 125 Hz, remains relatively flat around 2 dB until 2000 Hz, then decreases to approximately 2 dB at 4000 Hz.
### Key Observations
* The thresholds generally increase with signal frequency up to around 500-1000 Hz, then tend to plateau or decrease at higher frequencies.
* The differences in thresholds (bottom two charts) are relatively small and consistent across different models, suggesting a similar pattern of change in thresholds between the noise conditions.
* The models generally agree with each other, with some minor variations in the absolute threshold values.
### Interpretation
The data suggests that signal detection thresholds are influenced by both signal frequency and noise conditions. The increase in thresholds with frequency up to a certain point likely reflects the increasing difficulty of detecting signals at higher frequencies. The differences in thresholds between noise conditions (N<sub>Sπ</sub> - N<sub>S0π</sub>, etc.) indicate that the type of noise affects the detectability of signals. The consistency across different models suggests that the observed patterns are robust and not specific to any particular model or study. The small differences between the models could be due to variations in experimental setup, subject populations, or data analysis techniques. The overall pattern suggests that the models are capturing the fundamental relationship between signal frequency, noise, and detection thresholds.
DECODING INTELLIGENCE...