\n
## Heatmap: Numerical Grid
### Overview
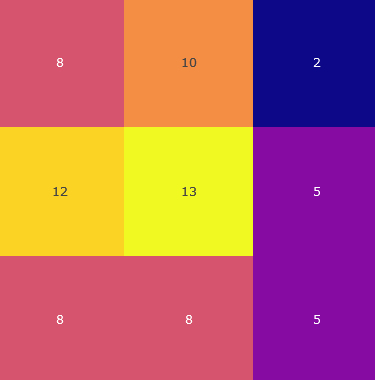
The image presents a 3x3 heatmap displaying numerical values within a grid of colored cells. The color intensity appears to correlate with the magnitude of the numerical value, ranging from deep blue (low values) to bright yellow (high values). There are no explicit axis labels or a legend provided.
### Components/Axes
The image consists of a 3x3 grid. Each cell contains a numerical value. The color scheme transitions from red/pink to orange to yellow to purple to dark blue. There are no axis titles or labels.
### Detailed Analysis or Content Details
The grid contains the following numerical values, with associated color observations:
* **Top-Left:** 8 (Reddish-Pink)
* **Top-Center:** 10 (Orange)
* **Top-Right:** 2 (Dark Blue)
* **Middle-Left:** 12 (Yellow)
* **Middle-Center:** 13 (Bright Yellow) - This is the highest value in the grid.
* **Middle-Right:** 5 (Purple)
* **Bottom-Left:** 8 (Reddish-Pink)
* **Bottom-Center:** 8 (Orange)
* **Bottom-Right:** 5 (Purple)
The values appear to be integers. The color gradient suggests a mapping where lower numbers are represented by darker, cooler colors (blue/purple) and higher numbers by brighter, warmer colors (yellow/orange/red).
### Key Observations
* The highest value (13) is located in the center of the grid.
* The lowest value (2) is located in the top-right corner.
* The values 8 and 5 appear multiple times.
* There is a symmetrical pattern in the values, with 8 appearing in the bottom-left and top-left, and 5 appearing in the bottom-right and middle-right.
### Interpretation
Without context, it's difficult to definitively interpret the meaning of this heatmap. However, the arrangement of values suggests a potential correlation or relationship between the grid positions. The central position having the highest value could indicate a focal point or maximum intensity. The symmetrical pattern of values might suggest a balanced or repeating phenomenon.
The data could represent various things, such as:
* **Sensor readings:** Values could represent temperature, pressure, or other sensor data at different locations.
* **Correlation matrix:** Values could represent the correlation between different variables.
* **Game board:** Values could represent scores or states in a game.
* **Image processing:** Values could represent pixel intensities in an image.
Further information about the source and meaning of the data is needed to draw more specific conclusions. The lack of axis labels and a legend limits the interpretability of the data.