## Heatmap: Unlabeled 3x3 Grid with Numerical Values and Color Coding
### Overview
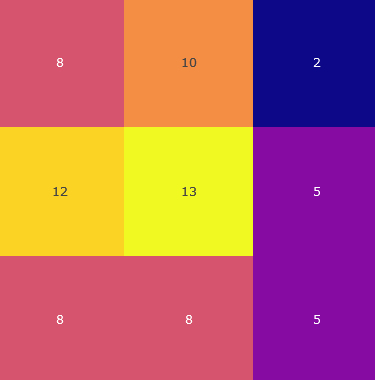
The image depicts a 3x3 grid where each cell contains a numerical value and a distinct color. No axis labels, legends, or contextual text are present. The grid appears to represent a matrix of discrete data points, with colors potentially indicating categories or ranges, though no explicit mapping is provided.
### Components/Axes
- **Grid Structure**:
- 3 rows and 3 columns.
- No axis titles, legends, or scale markers.
- **Cell Contents**:
- Each cell contains a single integer (e.g., 8, 10, 2) and a solid color (e.g., red, orange, blue).
- Colors vary across cells but lack a defined legend or gradient scale.
### Detailed Analysis
| Position | Value | Color |
|----------------|-------|-----------|
| Top-Left | 8 | Red |
| Top-Center | 10 | Orange |
| Top-Right | 2 | Blue |
| Middle-Left | 12 | Orange |
| Middle-Center | 13 | Yellow |
| Middle-Right | 5 | Purple |
| Bottom-Left | 8 | Red |
| Bottom-Center | 8 | Red |
| Bottom-Right | 5 | Purple |
- **Numerical Range**: Values span from **2** (minimum) to **13** (maximum).
- **Color Distribution**:
- Red: 3 cells (values 8, 8, 8).
- Orange: 2 cells (values 10, 12).
- Blue: 1 cell (value 2).
- Yellow: 1 cell (value 13).
- Purple: 2 cells (values 5, 5).
### Key Observations
1. **Highest Value**: The cell at **Middle-Center** (13) is the only yellow cell, suggesting a potential outlier or unique category.
2. **Lowest Value**: The cell at **Top-Right** (2) is the only blue cell, possibly indicating a distinct group or threshold.
3. **Color Ambiguity**: Without a legend, the relationship between colors and values is unclear. For example:
- Red cells contain mid-range values (8).
- Orange cells contain higher values (10, 12).
- Blue and yellow cells represent extremes (2, 13).
4. **Repetition**: The value **8** appears three times (all red), while **5** appears twice (both purple).
### Interpretation
- **Data Structure**: The grid likely represents a categorical or grouped dataset, with colors serving as visual markers rather than a continuous scale.
- **Trends**:
- The central cell (13) is the highest value, surrounded by lower values (12, 5, 8).
- The bottom row has two identical values (8, 8), suggesting possible grouping or repetition.
- **Uncertainties**:
- The purpose of color coding is undefined.
- No contextual labels prevent interpretation of what the numbers represent (e.g., counts, scores, measurements).
- **Notable Patterns**:
- The top row shows a sharp drop from 10 to 2, while the middle row peaks at 13.
- The bottom row has no variation in value (8, 8) but shares the same color (red).
### Conclusion
This heatmap-like grid highlights variability in numerical values across a 3x3 matrix. However, the absence of axis labels, legends, or contextual text limits the ability to draw definitive conclusions. The colors may serve as categorical indicators, but their meaning remains speculative without additional information. The data suggests potential groupings or thresholds, but further clarification is required to validate interpretations.