## Scatter Plot: Effect Size vs. Average Citation per Paper for Nobel Laureates and a Random Sample
### Overview
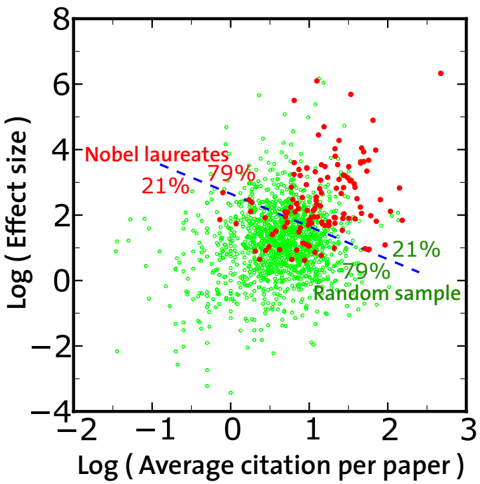
The image is a scatter plot comparing the logarithmic effect size and logarithmic average citation per paper for Nobel laureates (represented by red dots) and a random sample (represented by green dots). The plot also includes a dashed blue line indicating a separation between the two groups, with percentages indicating the proportion of each group above and below the line.
### Components/Axes
* **X-axis:** Log (Average citation per paper). The axis ranges from approximately -2 to 3, with tick marks at every integer value.
* **Y-axis:** Log (Effect size). The axis ranges from approximately -4 to 8, with tick marks at every integer value.
* **Data Series 1:** Nobel laureates (red dots).
* **Data Series 2:** Random sample (green dots).
* **Separation Line:** A dashed blue line that slopes downward from left to right.
* **Percentages:** "79%" and "21%" are associated with each side of the separation line for both Nobel laureates and the random sample.
### Detailed Analysis
* **Nobel Laureates (Red Dots):**
* The red dots representing Nobel laureates are concentrated in the upper-right quadrant of the plot, indicating a tendency for higher effect sizes and higher average citations per paper.
* The distribution is somewhat scattered, but there is a noticeable cluster around the region where Log (Average citation per paper) is between 0.5 and 1.5, and Log (Effect size) is between 2 and 4.
* Above the dashed blue line, 21% of the Nobel laureates are located.
* Below the dashed blue line, 79% of the Nobel laureates are located.
* **Random Sample (Green Dots):**
* The green dots representing the random sample are more widely distributed across the plot, with a higher concentration in the lower-left quadrant.
* The distribution appears more uniform compared to the Nobel laureates, with a larger spread in both effect size and average citation per paper.
* Above the dashed blue line, 79% of the random sample is located.
* Below the dashed blue line, 21% of the random sample is located.
* **Separation Line (Dashed Blue):**
* The dashed blue line visually separates the two groups, with a higher proportion of Nobel laureates located below the line and a higher proportion of the random sample located above the line.
* The line starts at approximately (x=-1, y=4) and ends at approximately (x=2, y=0).
### Key Observations
* Nobel laureates tend to have higher effect sizes and average citations per paper compared to the random sample.
* The distributions of the two groups are distinct, with the Nobel laureates showing a more concentrated pattern.
* The dashed blue line provides a visual separation between the two groups, highlighting the differences in their distributions.
### Interpretation
The scatter plot suggests a correlation between receiving a Nobel Prize and having both a higher effect size and a higher average citation per paper. The concentration of Nobel laureates in the upper-right quadrant indicates that their work tends to have a greater impact and is more frequently cited compared to the random sample. The dashed blue line and the associated percentages provide a quantitative measure of the separation between the two groups, indicating that a significant proportion of Nobel laureates have higher values for both metrics compared to the random sample. This could imply that Nobel laureates, on average, produce more influential and impactful research. The percentages near the dashed line indicate the proportion of each group that falls on either side of the line, further emphasizing the distinction between the two groups.