## Scatter Plot: Effect Size vs. Citation Impact of Nobel Laureates and Random Sample
### Overview
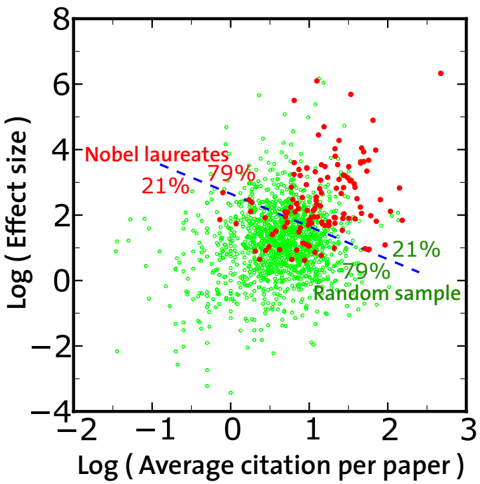
This image presents a scatter plot comparing the effect size and average citation per paper for two groups: Nobel laureates and a random sample of researchers. The plot uses a logarithmic scale for both axes. The data points are color-coded to distinguish between the two groups, with additional annotations indicating confidence intervals.
### Components/Axes
* **X-axis:** Log (Average citation per paper). Scale ranges from approximately -2 to 3.
* **Y-axis:** Log (Effect size). Scale ranges from approximately -4 to 8.
* **Data Series 1:** Nobel laureates (represented by red dots).
* **Data Series 2:** Random sample (represented by green dots).
* **Annotations:**
* "Nobel laureates" label positioned in the top-left quadrant.
* "Random sample" label positioned in the bottom-right quadrant.
* "79%" and "21%" labels with dashed blue lines indicating confidence intervals for Nobel laureates.
* "79%" and "21%" labels with dashed blue lines indicating confidence intervals for the random sample.
### Detailed Analysis
The scatter plot shows a clear distinction between the two groups.
**Nobel Laureates (Red Dots):**
* The data points are generally clustered towards the upper-right portion of the plot, indicating higher effect sizes and citation counts.
* The distribution is somewhat elongated, with a tail extending towards higher effect sizes.
* The trend is generally upward sloping, meaning that as citation counts increase, effect sizes also tend to increase.
* Approximate data points (estimated from visual inspection):
* ( -1.5, 1.5): A few points are present.
* (0, 1.5): A cluster of points.
* (0, 4): A few points.
* (1, 2): A dense cluster of points.
* (1, 5): A few points.
* (2, 3): A few points.
* (2.5, 6): One outlier.
**Random Sample (Green Dots):**
* The data points are more dispersed and concentrated towards the lower-left portion of the plot, indicating lower effect sizes and citation counts.
* The distribution is more circular, with no strong directional trend.
* Approximate data points (estimated from visual inspection):
* (-2, -2): A few points.
* (-1, 0): A cluster of points.
* (0, 0): A dense cluster of points.
* (1, 0): A cluster of points.
* (1, 1): A few points.
* (2, 0): A few points.
**Confidence Intervals (Blue Dashed Lines):**
* For Nobel laureates, the 79% confidence interval line is approximately at x=0.7, y=2.2. The 21% confidence interval line is approximately at x=0.3, y=1.5.
* For the random sample, the 79% confidence interval line is approximately at x=0.2, y=0.5. The 21% confidence interval line is approximately at x=-0.2, y=0.2.
### Key Observations
* Nobel laureates consistently exhibit higher effect sizes and citation counts compared to the random sample.
* The confidence intervals suggest that the difference between the two groups is statistically significant.
* There is a positive correlation between citation count and effect size for Nobel laureates.
* The random sample shows a wider spread of data points, indicating greater variability in effect sizes and citation counts.
### Interpretation
The data strongly suggests that Nobel laureates, as a group, produce research with both greater impact (measured by citations) and larger effect sizes. This is not surprising, as the Nobel Prize is awarded for groundbreaking work. The confidence intervals provide statistical support for this observation, indicating that the observed difference is unlikely to be due to chance. The positive correlation between citation count and effect size for Nobel laureates suggests that their highly cited work also tends to have a substantial impact on their field. The wider spread of data points in the random sample indicates that research quality and impact vary more widely among researchers who have not received a Nobel Prize. The logarithmic scales used for both axes likely compress the distribution of the data, making it easier to visualize the differences between the two groups. The use of a random sample as a baseline allows for a comparison of the Nobel laureates' performance against a broader population of researchers.